Average Rent in St Louis, MO
32 apartment buildings, 399 units. Daily asking prices with rent history for every building.
Cheapest
$695/mo
Efthim Company Realtors
Properties
32
tracked daily
Units
399
available now
St Louis, MO Resident Access
City Club members share insider gate codes, parking links, and amenity tips.
Analysis
Rent Price Breakdown
Compare pricing across all 32 properties in St Louis, MO.
Median rent trend, last 2 months
All bedroom types, citywide. Choose a window above to scope the view.
Average Rent by Property
Starting Price vs Average
Rent by Bedroom Count
Price per Square Foot
St Louis, MO Rent Prices
All 32 properties ranked by lowest available rent.
Efthim Company Realtors
3605 Watson Rd, St. Louis, MO 63109, USA
Kingsland Properties
2750 Lafayette Ave, St. Louis, MO 63104, USA
Mogul Realty
6780 Southwest Ave, St. Louis, MO 63143, USA
Apartment Exchange
2203 S Big Bend Blvd Suite 102, St. Louis, MO 63117, USA
Mac Properties - Saint Louis Apartments
18 S Kingshighway Blvd, St. Louis, MO 63108, USA
Reconnect Real Estate
5223 S Grand Blvd, St. Louis, MO 63111, USA
SF Shannon Real Estate Management LLC
4917 McPherson Ave, St. Louis, MO 63108, USA
| # | Property | From | Avg | $/sqft | Rating | Units |
|---|---|---|---|---|---|---|
| 1 | Efthim Company Realtors 3605 Watson Rd, St. Louis, MO 63109, USA | $695 | $1,077 | $1.26 | 4.2 (168) | 16 |
| 2 | Kingsland Properties 2750 Lafayette Ave, St. Louis, MO 63104, USA | $695 | $974 | $1.20 | 4.6 (614) | 12 |
| 3 | Mogul Realty 6780 Southwest Ave, St. Louis, MO 63143, USA | $695 | $749 | $0.86 | 4.4 (92) | 5 |
| 4 | Apartment Exchange 2203 S Big Bend Blvd Suite 102, St. Louis, MO 63117, USA | $745 | $1,364 | $1.31 | 3.4 (63) | 10 |
| 5 | Mac Properties - Saint Louis Apartments 18 S Kingshighway Blvd, St. Louis, MO 63108, USA | $745 | $1,600 | -- | 3.9 (136) | 22 |
| 6 | Reconnect Real Estate 5223 S Grand Blvd, St. Louis, MO 63111, USA | $775 | $968 | $1.09 | 4.1 (115) | 10 |
| 7 | SF Shannon Real Estate Management LLC 4917 McPherson Ave, St. Louis, MO 63108, USA | $785 | $927 | $2.05 | 4.9 (234) | 10 |
Rent & Price History by Building
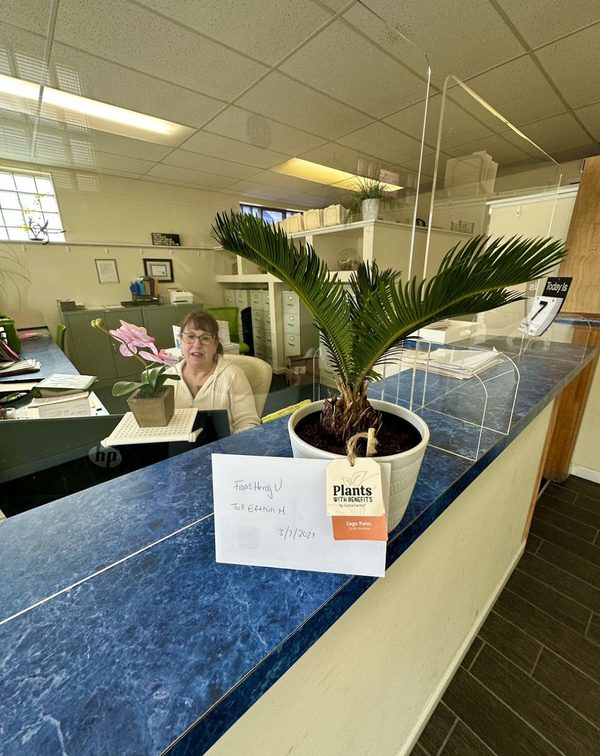
Efthim Company Realtors
4.2 (168)3605 Watson Rd, St. Louis, MO 63109, USA
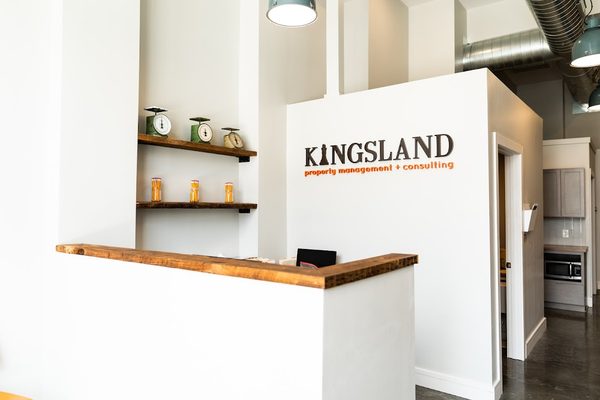
Kingsland Properties
4.6 (614)2750 Lafayette Ave, St. Louis, MO 63104, USA

Mogul Realty
4.4 (92)6780 Southwest Ave, St. Louis, MO 63143, USA
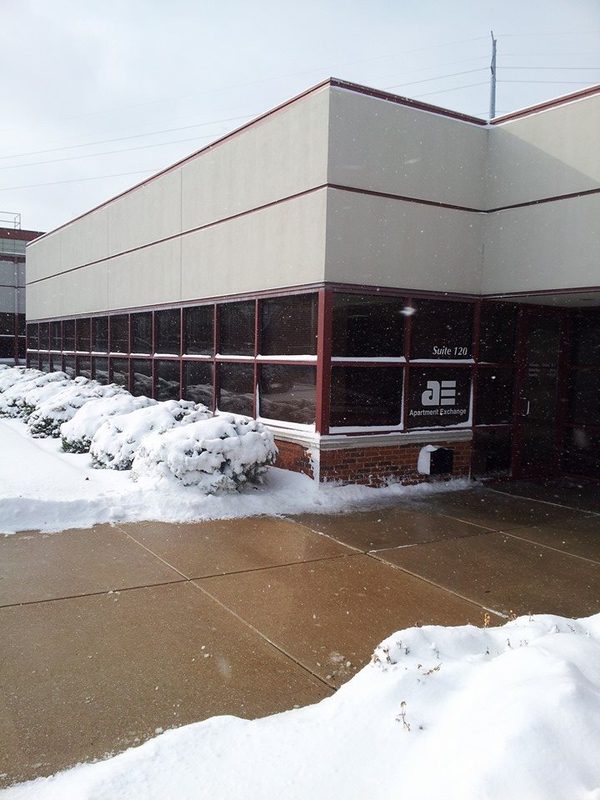
Apartment Exchange
3.4 (63)2203 S Big Bend Blvd Suite 102, St. Louis, MO 63117, USA

Mac Properties - Saint Louis Apartments
3.9 (136)18 S Kingshighway Blvd, St. Louis, MO 63108, USA

Reconnect Real Estate
4.1 (115)5223 S Grand Blvd, St. Louis, MO 63111, USA


By Area
St Louis, MO neighborhoods
Tracked buildings across 9 named neighborhoods. Pick one to see its apartments.
St Louis, MO Average Rent Prices 2026
The average rent in St Louis, MO is $1,549 per month, based on 399 units across 32 apartment communities. Prices range from $695 at Efthim Company Realtors to $4,299 at One Foundry Way.
Average Rent by Bedroom Type
| Type | Avg Rent | Starting From | Units |
|---|---|---|---|
| Studio | $1,221/mo | $785/mo | 65 |
| 1 Bed | $1,473/mo | $695/mo | 193 |
| 2 Bed | $1,795/mo | $800/mo | 115 |
| 3 Bed | $2,007/mo | $1,015/mo | 20 |
| 4 Bed | $1,530/mo | $1,017/mo | 3 |
| 5 Bed | $1,085/mo | $1,052/mo | 3 |
Every price is a real asking rent, updated that morning. Request a neighborhood we don't cover and we add it within 24 hours.
Market Context
Who rents in St Louis, MO, and what they pay
Tracked one-bedroom rent in St Louis, MO averages $1,473/mo, with two-bedroom units averaging $1,795/mo. At the local median household income of $55,279, that works out to 34% of gross income, above the 30 percent affordability ceiling, a stretched-budget market.
The U.S. Census Bureau's American Community Survey 2023 release pegged median gross rent in St Louis, MO at $978/mo. The current tracked market average runs 58% higher than that benchmark, reflecting both two to three years of rent growth and the fact that the Census figure covers all renter-occupied housing in St Louis, MO while the tracked market average covers units currently listed in larger apartment communities.
Who employs renters in St. Louis
Demand in the St. Louis rental market is shaped by the metro's largest private and public employers. The following organizations anchor local hiring and influence what renters can pay:
- Anheuser-Busch
- Emerson Electric
- Monsanto (Bayer)
- Centene
- Washington University
Mean one-way commute in St Louis, MO is 22 minutes, per the Census ACS, useful context when weighing which properties sit inside reasonable reach of these employers.
What salary do I need to live comfortably in St Louis, MO?
Built on the 25 to 30 percent rent-to-income guideline used by most landlords and credit-scoring models.
Minimum to afford average rent
$62,000/year
Based on the 30 percent rule, using our tracked average rent of $1,549/mo.
Comfortable income
$74,000/year
Based on the 25 percent rule, leaving more room for savings, transport, and groceries.
To afford the cheapest tracked apartment ($695/mo), you need to earn at least $28,000/year.
Median household income in St Louis, MO is $55,279 , about 26% below the comfortable-living threshold.
Cost of living in St Louis, MO
Overall prices in St Louis, MO runs below the national average by about 5% (BEA Regional Price Parity index 95.0, where 100 equals the U.S. average). The breakdown below estimates monthly costs for a single adult, using national consumer-spending baselines from the Bureau of Labor Statistics scaled by St Louis, MO's regional price parities.
| Category | Monthly estimate |
|---|---|
| Rent (market average) | $1,549 |
| Utilities | $347 |
| Groceries | $533 |
| Transportation | $826 |
| Healthcare | $403 |
| Other goods and services | $645 |
| Estimated total | $4,302/mo |
Population
293,109
Median household income
$55,279
Census median rent
$978/mo
Rent as % of income
27.9%
Median age
36.6
Mean commute
22 min
Methodology
Rent data
Sourced directly from each tracked apartment community and refreshed every 24 hours. Every listed unit price on this page is real and listed today.
Cost of living
Estimates combine national consumer-spending baselines from the U.S. Bureau of Labor Statistics (Consumer Expenditure Survey) with the U.S. Bureau of Economic Analysis Regional Price Parities (MARPP dataset). Both are peer-reviewed federal data releases published annually.
Salary to live comfortably
Applies the standard 25 to 30 percent rent-to-income rule on top of the listed rent. This is the same affordability guideline used by most landlords and credit-scoring models.
Demographic figures
Median household income, population, median age, commute time, Census median rent, and rent as percentage of income come from the U.S. Census Bureau's American Community Survey 5-year estimates, the most recent complete release.
Cost of living and demographic figures were last published in 2023.
Compare
Nearby cities in Missouri
How St Louis, MO rent compares to other markets in the state.
| City | Avg Rent | vs St Louis, MO | 30-Day Change | Properties |
|---|---|---|---|---|
| Kansas City, MO | $1,842 | +19% | +10.4% | 26 |
| Springfield, MO | $1,322 | -15% | +5.2% | 24 |
| Independence, MO | $1,291 | -17% | -3.2% | 13 |
| Lee S Summit, MO | $1,671 | +8% | +9.7% | 12 |
| ST Peters, MO | $1,736 | +12% | -- | 11 |
| ST Charles, MO | $1,703 | +10% | -3.7% | 10 |
Frequently asked questions
What is the average rent in St Louis, MO?
The average rent in St Louis, MO is $1,549 per month, based on 399 units across 32 apartment buildings tracked by Average Rent. Prices are refreshed daily.
What is the median rent in St Louis, MO?
The median asking rent in St Louis, MO is $1,495 per month, computed from 399 live listed units and refreshed daily. The average is $1,549/mo; the median resists skew from luxury listings.
What is the cheapest apartment rent in St Louis, MO?
The lowest available rent in St Louis, MO starts at $695 per month. Availability changes daily and prices are refreshed each morning.
How much is a 1-bedroom apartment in St Louis, MO?
1-bedroom apartments in St Louis, MO average $1,473/mo. The lowest listed 1-bedroom starts at $695/mo across 193 units tracked.
How much is a 2-bedroom apartment in St Louis, MO?
2-bedroom apartments in St Louis, MO average $1,795/mo. Units start from $800/mo across 115 units currently listed.
Rent Trends in St Louis, MO
Track how apartment prices are changing over time.
Missing your neighborhood?
Tell us where you're looking. We'll start tracking prices within 24 hours.
Get Started