Average Rent in Albuquerque, NM
143 apartment buildings, 1637 units. Real asking prices, refreshed daily. 19 more available with Average Rent Pro
Cheapest
$649/mo
Volcanes Commons
Properties
143
tracked daily
Units
1637
available now
Albuquerque, NM Resident Access
City Club members share insider gate codes, parking links, and amenity tips.
Analysis
Rent Price Breakdown
Compare pricing across all 143 properties in Albuquerque, NM.
Median rent trend, last 2 months
All bedroom types, citywide. Choose a window above to scope the view.
Average Rent by Property
Starting Price vs Average
Rent by Bedroom Count
Price per Square Foot
Albuquerque, NM Rent Prices
All 143 properties ranked by lowest available rent.
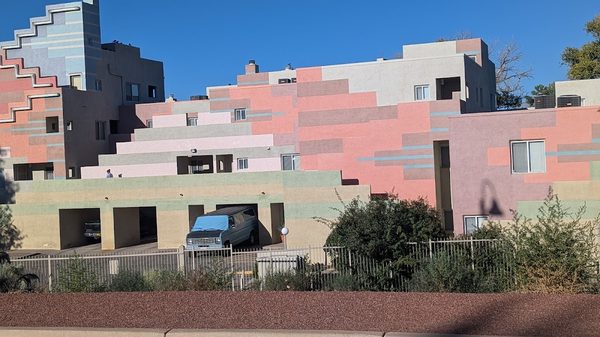
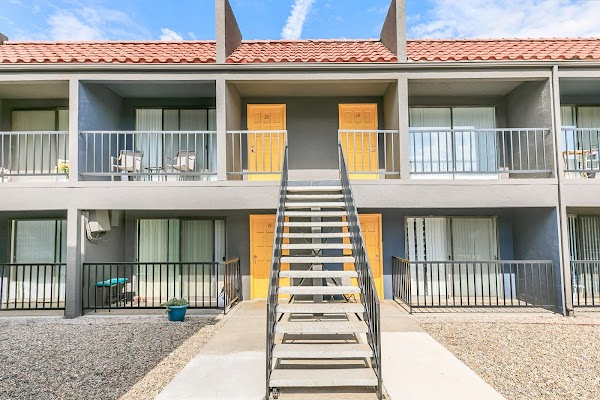
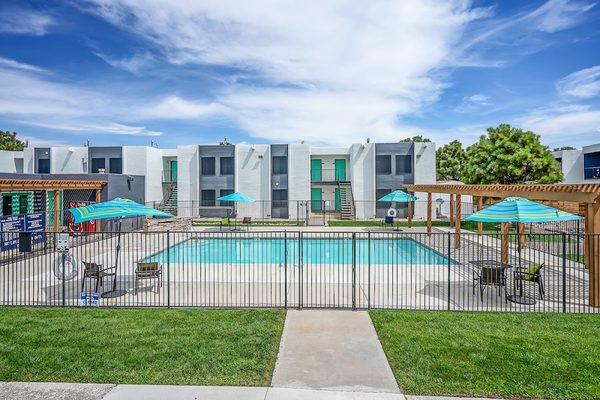
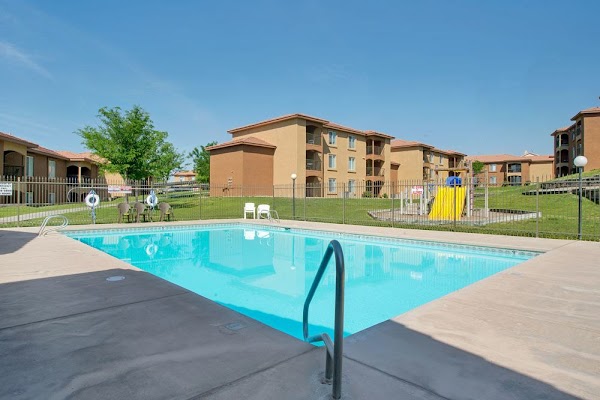
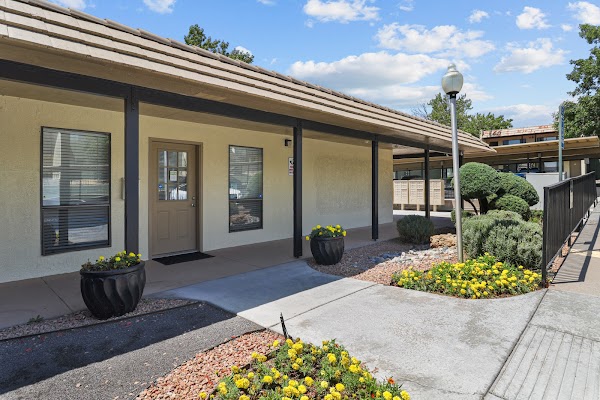
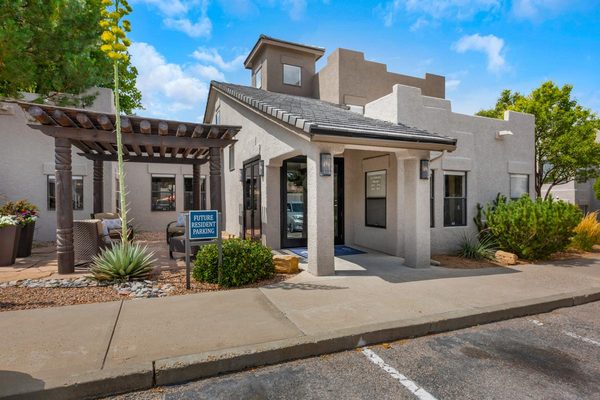
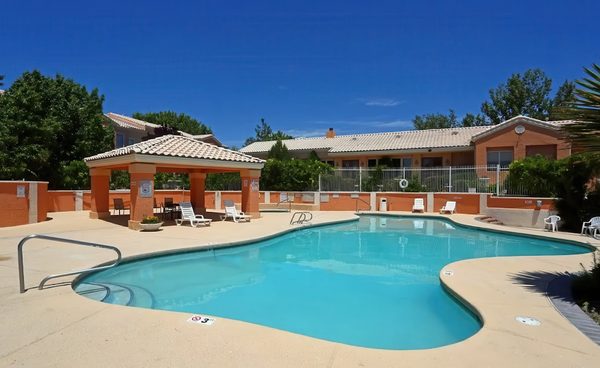
Volcanes Commons
6901 Glenrio Rd NW, Albuquerque, NM 87121, USA
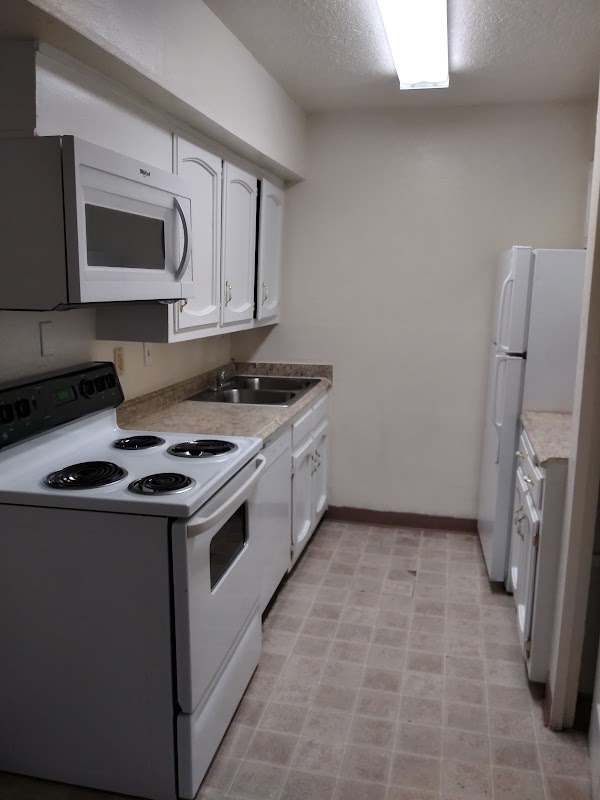
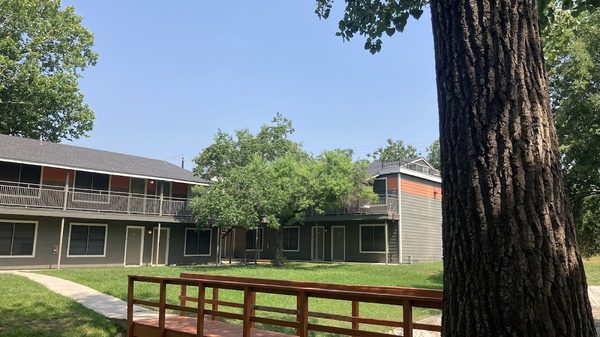
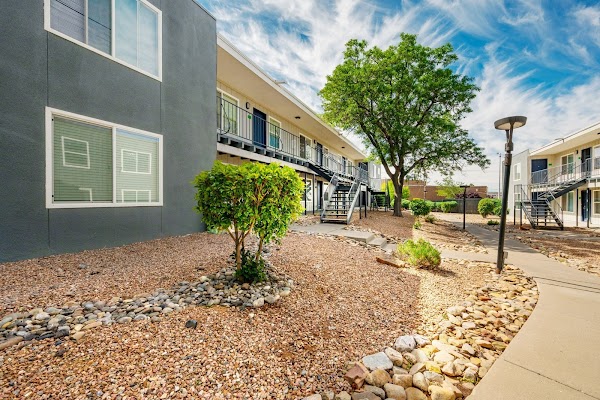
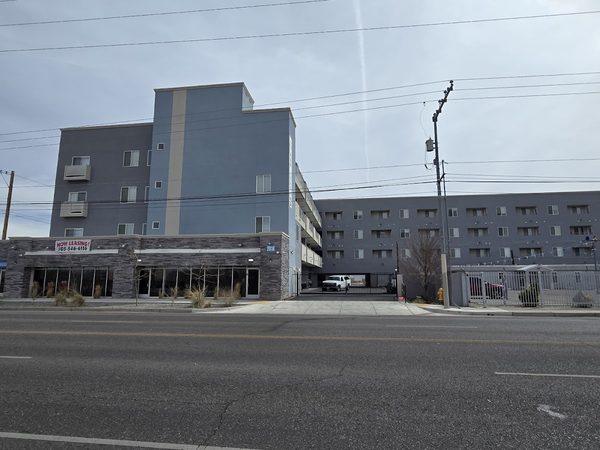
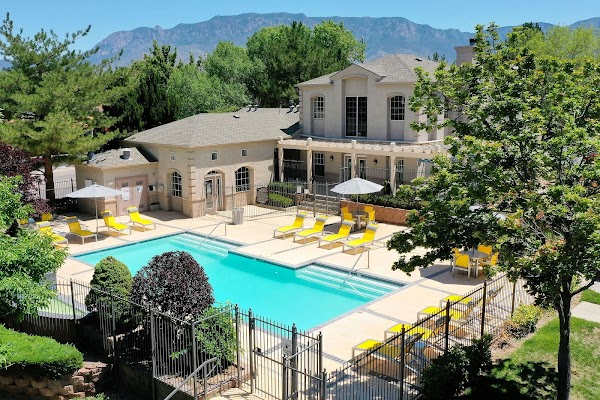
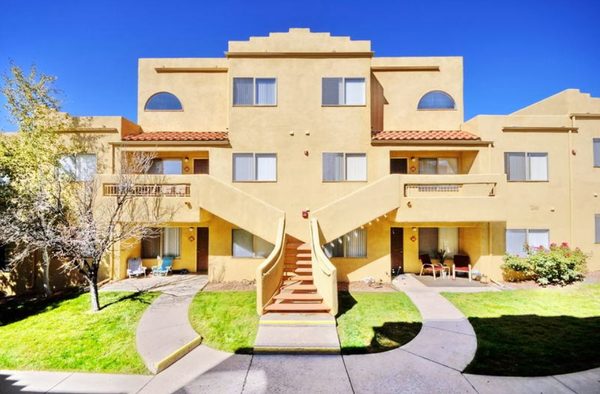
The Cedars Apartments
1700 Indian Plaza Dr NE, Albuquerque, NM 87106, USA
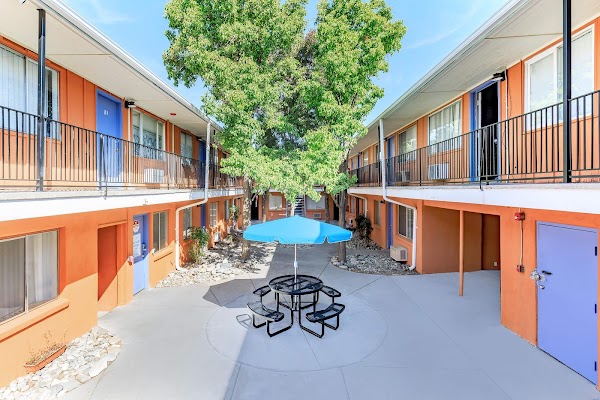
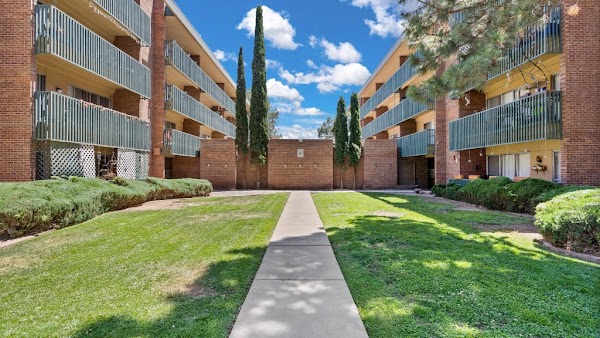
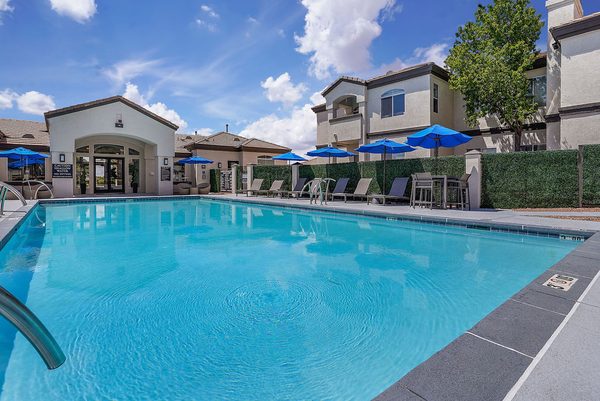
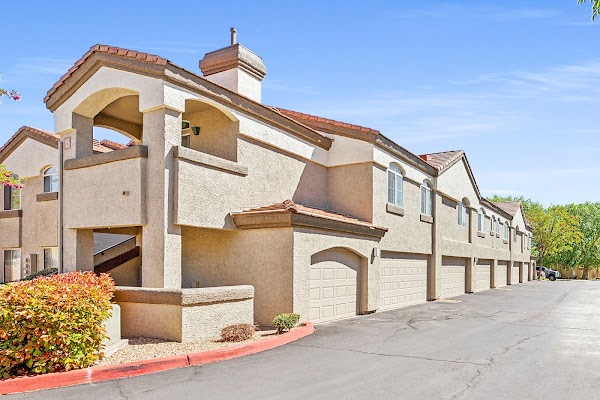
Desert Creek Apartments
4300 Pan American Fwy NE, Albuquerque, NM 87107, USA
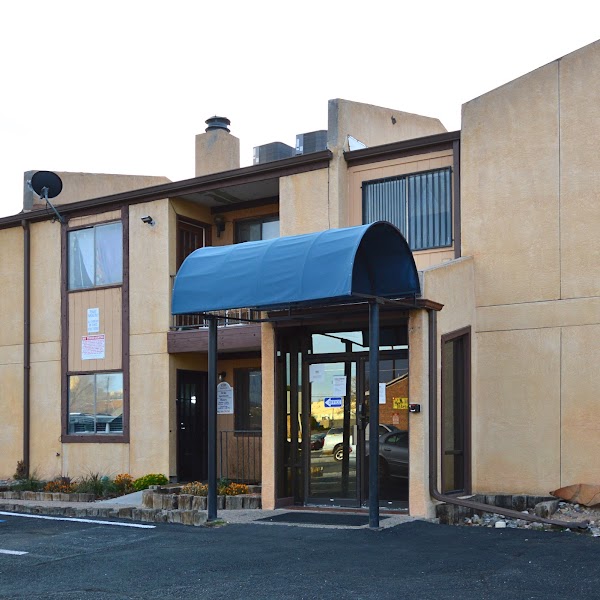
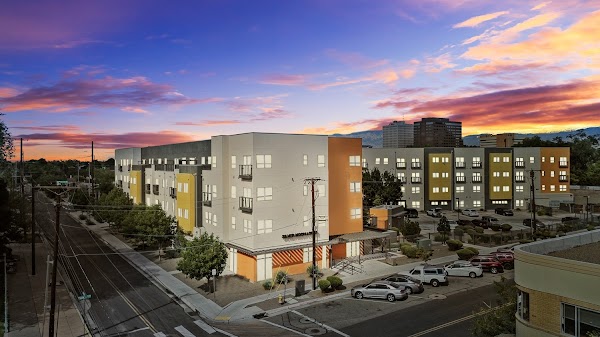
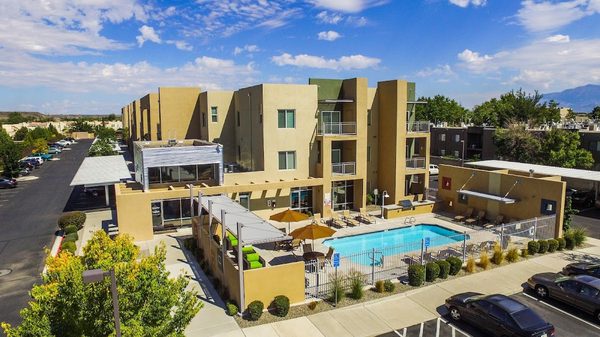
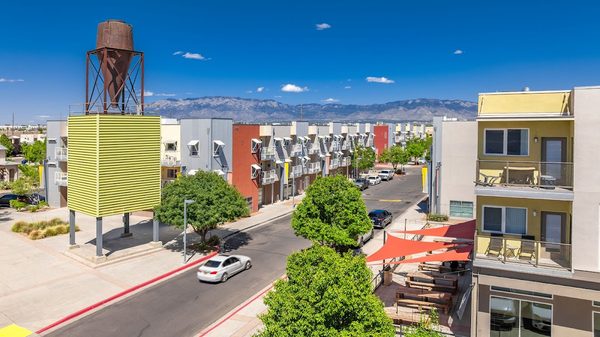
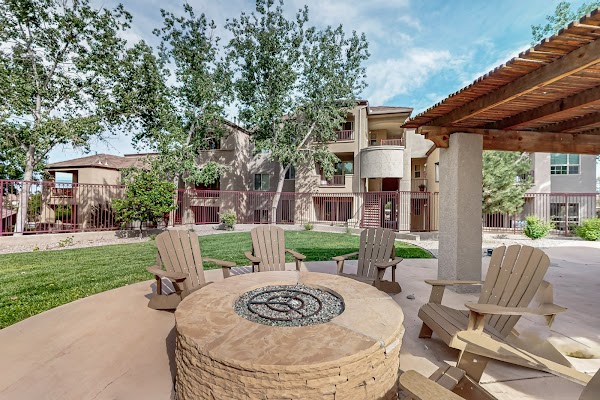
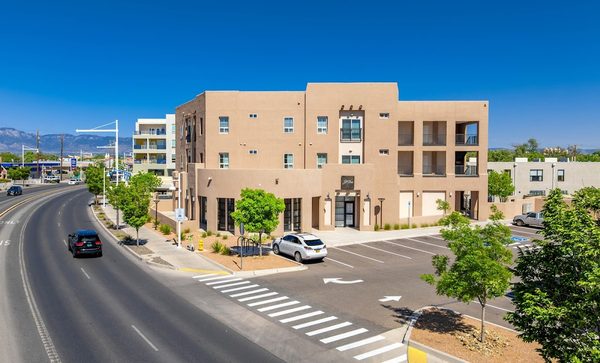
Bricklight District
143 Harvard Dr SE, Albuquerque, NM 87106, USA
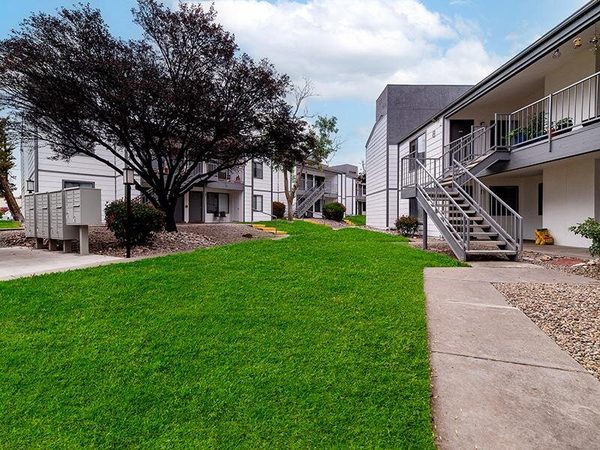
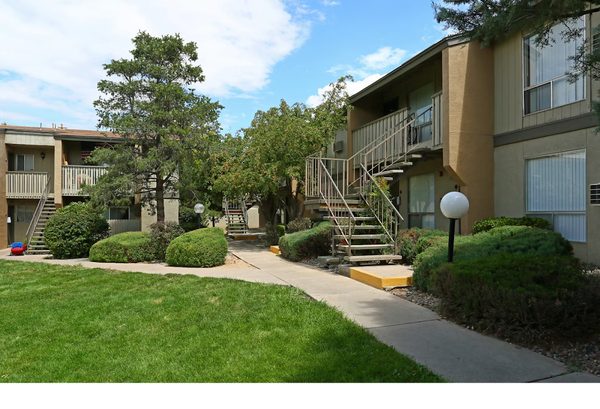
Nova View
1330 Louisiana Blvd NE, Albuquerque, NM 87110, USA
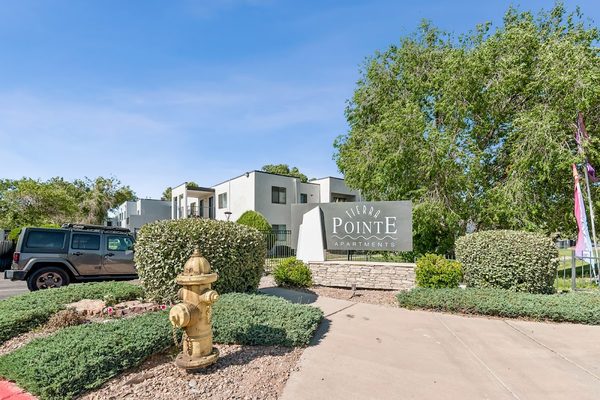
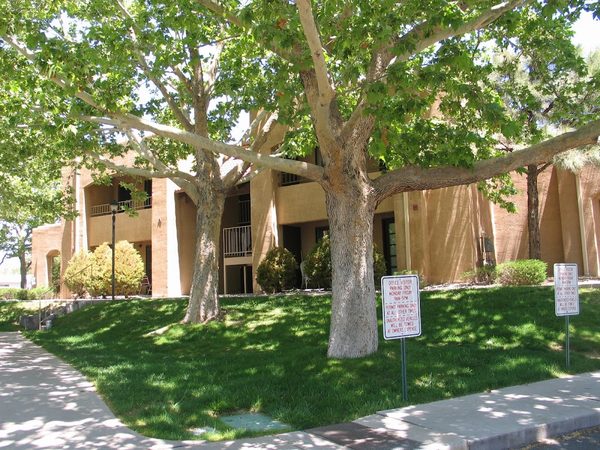
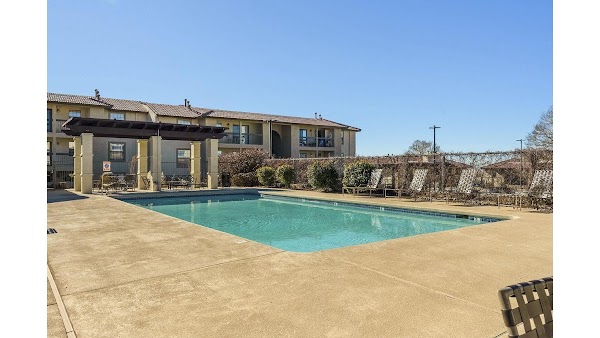
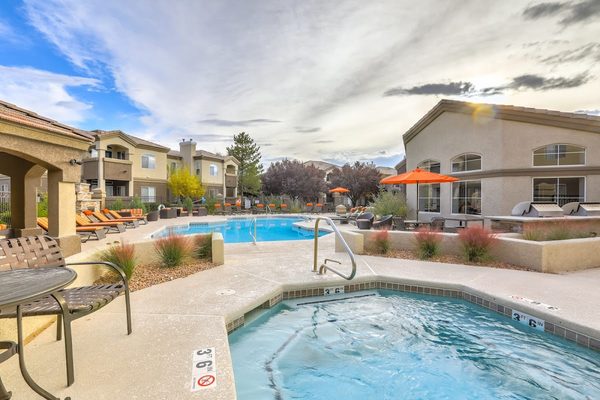
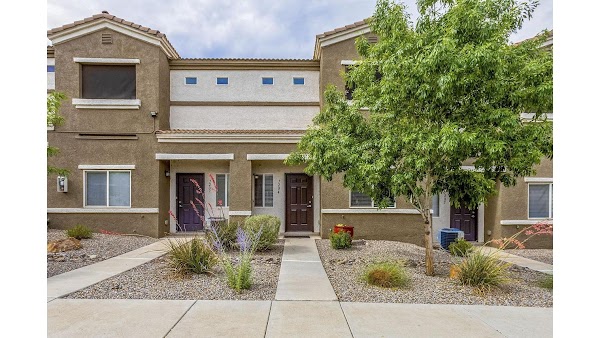
Tesota Four Hills
301 Western Skies Dr SE, Albuquerque, NM 87123, USA
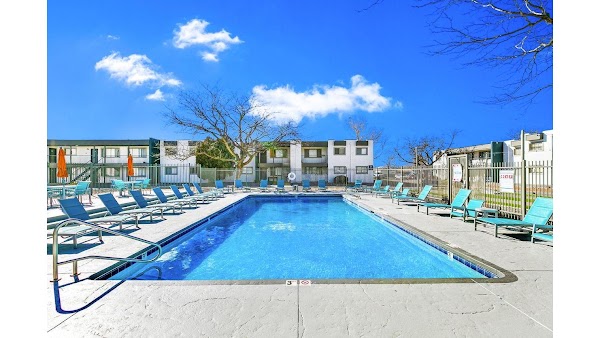
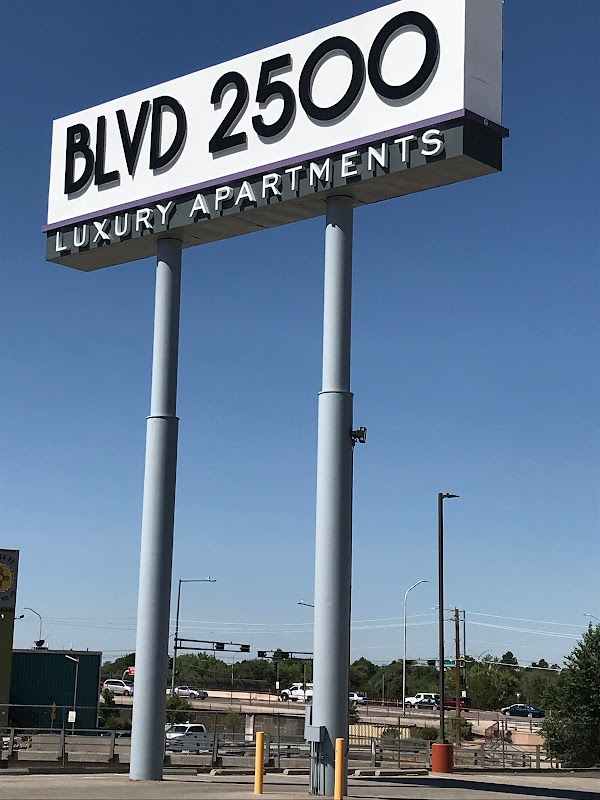
BLVD 2500 Luxury Apartments
2500 Carlisle Blvd NE, Albuquerque, NM 87110, USA
| # | Property | From | Avg | $/sqft | Rating | Units |
|---|---|---|---|---|---|---|
| 1 | Volcanes Commons 6901 Glenrio Rd NW, Albuquerque, NM 87121, USA | $649 | $1,011 | $1.21 | 2.7 (62) | 182 |
| 2 | The Cedars Apartments 1700 Indian Plaza Dr NE, Albuquerque, NM 87106, USA | $724 | $803 | $1.63 | 3.5 (59) | 4 |
| 3 | Desert Creek Apartments 4300 Pan American Fwy NE, Albuquerque, NM 87107, USA | $725 | $1,096 | $1.74 | 3.3 (189) | 10 |
| 4 | Bricklight District 143 Harvard Dr SE, Albuquerque, NM 87106, USA | $750 | $1,106 | $1.46 | 4.4 (19) | 7 |
| 5 | Nova View 1330 Louisiana Blvd NE, Albuquerque, NM 87110, USA | $750 | $964 | $1.59 | 4 (76) | 7 |
| 6 | Tesota Four Hills 301 Western Skies Dr SE, Albuquerque, NM 87123, USA | $760 | $928 | $1.23 | 3.4 (192) | 18 |
| 7 | BLVD 2500 Luxury Apartments 2500 Carlisle Blvd NE, Albuquerque, NM 87110, USA | $765 | $963 | $1.72 | 3.3 (103) | 4 |
Explore Each Property

Volcanes Commons
2.7 (62)6901 Glenrio Rd NW, Albuquerque, NM 87121, USA
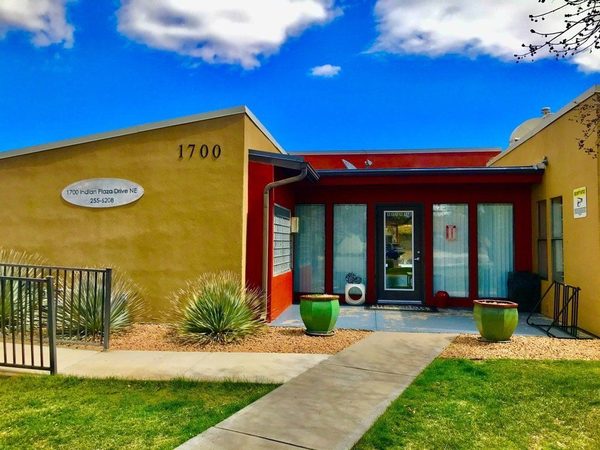
The Cedars Apartments
3.5 (59)1700 Indian Plaza Dr NE, Albuquerque, NM 87106, USA
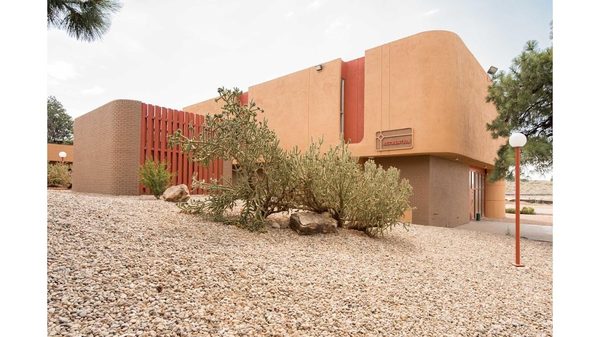
Desert Creek Apartments
3.3 (189)4300 Pan American Fwy NE, Albuquerque, NM 87107, USA
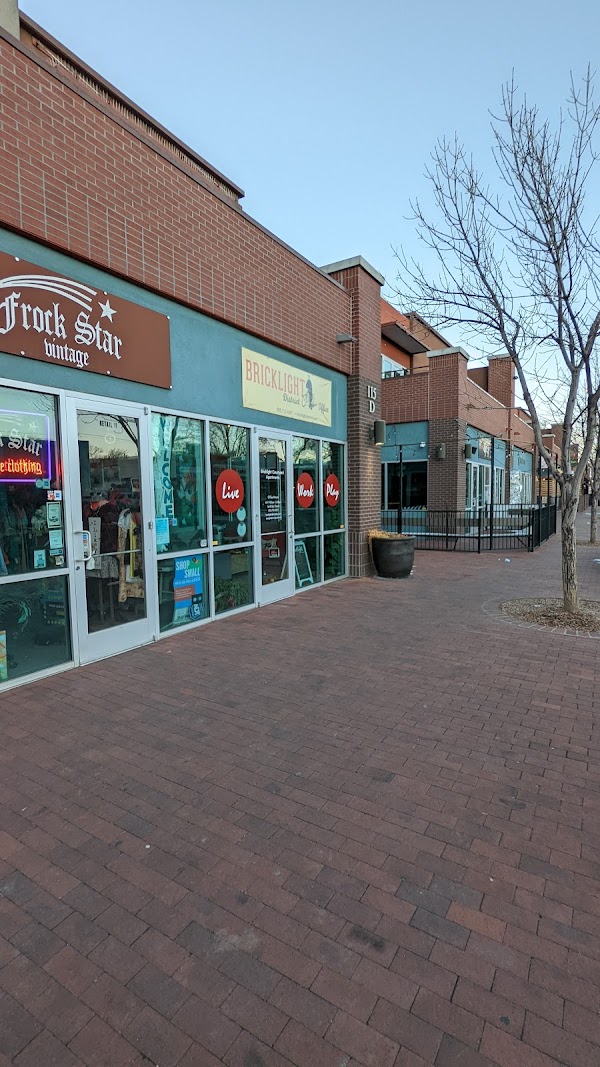
Bricklight District
4.4 (19)143 Harvard Dr SE, Albuquerque, NM 87106, USA
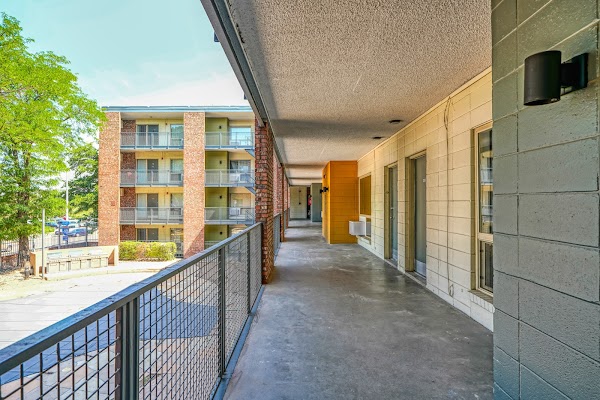
Nova View
4 (76)1330 Louisiana Blvd NE, Albuquerque, NM 87110, USA
Tesota Four Hills
3.4 (192)301 Western Skies Dr SE, Albuquerque, NM 87123, USA


By Area
Albuquerque, NM neighborhoods
Tracked buildings across 15 named neighborhoods. Pick one to see its apartments.
Albuquerque, NM Average Rent Prices 2026
The average rent in Albuquerque, NM is $1,472 per month, based on 1637 units across 143 apartment communities. Prices range from $649 at Volcanes Commons to $3,523 at Overture Andalucia.
Average Rent by Bedroom Type
| Type | Avg Rent | Starting From | Units |
|---|---|---|---|
| Studio | $1,307/mo | $724/mo | 192 |
| 1 Bed | $1,342/mo | $649/mo | 602 |
| 2 Bed | $1,546/mo | $778/mo | 672 |
| 3 Bed | $1,829/mo | $870/mo | 165 |
| 4 Bed | $1,640/mo | $1,525/mo | 6 |
Every price is a real asking rent, updated that morning. Request a neighborhood we don't cover and we add it within 24 hours.
Building Economics
How much do Albuquerque, NM apartments earn?
The 18 buildings we can estimate generate about $4.6M in rental revenue per month ($55M a year). Estimated from each building's unit-level listing and leasing activity.
| Building | Est. Monthly Revenue | Asking / Leased | Est. Occupancy | Units |
|---|---|---|---|---|
| 1.La Paloma Apartments | $679K/mo | $1,746 / $1,690 | 95% | 424 |
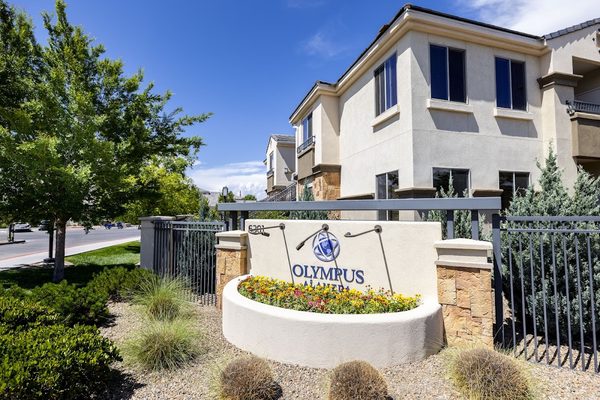
| 2.Olympus Alameda | $617K/mo | $1,837 / $1,899 | 89% | 367 |
| 3.Las Mananitas Luxury Apartments | $523K/mo | $1,789 / $1,773 | 98% | 300 |
| 4.Andalucia Villas | $454K/mo | $2,211 / $2,093 | 90% | 241 |
| 5.The Lakes Apartments | $362K/mo | $1,256 / $1,266 | 96% | 299 |
Research estimates from listing activity, not operator financials. Asking is the average listed rent; leased is the average rent at which units left the market. Click any building for the full revenue breakdown and methodology.
Market Context
Who rents in Albuquerque, NM, and what they pay
Tracked one-bedroom rent in Albuquerque, NM averages $1,342/mo, with two-bedroom units averaging $1,546/mo. At the local median household income of $65,604, that works out to 27% of gross income, near the 30 percent affordability ceiling.
The U.S. Census Bureau's American Community Survey 2023 release pegged median gross rent in Albuquerque, NM at $1,085/mo. The current tracked market average runs 36% higher than that benchmark, reflecting both two to three years of rent growth and the fact that the Census figure covers all renter-occupied housing in Albuquerque, NM while the tracked market average covers units currently listed in larger apartment communities.
Who employs renters in Albuquerque
Demand in the Albuquerque rental market is shaped by the metro's largest private and public employers. The following organizations anchor local hiring and influence what renters can pay:
- Sandia National Laboratories
- Kirtland Air Force Base
- University of New Mexico
- Presbyterian Healthcare
Mean one-way commute in Albuquerque, NM is 22 minutes, per the Census ACS, useful context when weighing which properties sit inside reasonable reach of these employers.
What salary do I need to live comfortably in Albuquerque, NM?
Built on the 25 to 30 percent rent-to-income guideline used by most landlords and credit-scoring models.
Minimum to afford average rent
$59,000/year
Based on the 30 percent rule, using our tracked average rent of $1,472/mo.
Comfortable income
$71,000/year
Based on the 25 percent rule, leaving more room for savings, transport, and groceries.
To afford the cheapest tracked apartment ($649/mo), you need to earn at least $26,000/year.
Median household income in Albuquerque, NM is $65,604 , about 7% below the comfortable-living threshold.
Cost of living in Albuquerque, NM
Overall prices in Albuquerque, NM runs below the national average by about 6% (BEA Regional Price Parity index 93.6, where 100 equals the U.S. average). The breakdown below estimates monthly costs for a single adult, using national consumer-spending baselines from the Bureau of Labor Statistics scaled by Albuquerque, NM's regional price parities.
| Category | Monthly estimate |
|---|---|
| Rent (market average) | $1,472 |
| Utilities | $382 |
| Groceries | $526 |
| Transportation | $909 |
| Healthcare | $444 |
| Other goods and services | $710 |
| Estimated total | $4,442/mo |
Population
562,488
Median household income
$65,604
Census median rent
$1,085/mo
Rent as % of income
31.1%
Median age
38.7
Mean commute
22 min
Methodology
Rent data
Sourced directly from each tracked apartment community and refreshed every 24 hours. Every listed unit price on this page is real and listed today.
Cost of living
Estimates combine national consumer-spending baselines from the U.S. Bureau of Labor Statistics (Consumer Expenditure Survey) with the U.S. Bureau of Economic Analysis Regional Price Parities (MARPP dataset). Both are peer-reviewed federal data releases published annually.
Salary to live comfortably
Applies the standard 25 to 30 percent rent-to-income rule on top of the listed rent. This is the same affordability guideline used by most landlords and credit-scoring models.
Demographic figures
Median household income, population, median age, commute time, Census median rent, and rent as percentage of income come from the U.S. Census Bureau's American Community Survey 5-year estimates, the most recent complete release.
Cost of living and demographic figures were last published in 2023.
Compare
Nearby cities in New Mexico
How Albuquerque, NM rent compares to other markets in the state.
| City | Avg Rent | vs Albuquerque, NM | 30-Day Change | Properties |
|---|---|---|---|---|
| Las Cruces, NM | $1,397 | -5% | +2.5% | 12 |
| Rio Rancho, NM | $1,941 | +32% | +2.3% | 8 |
| Santa FE, NM | $2,090 | +42% | -- | 8 |
Frequently asked questions
What is the average rent in Albuquerque, NM?
The average rent in Albuquerque, NM is $1,472 per month, based on 1637 units across 143 apartment buildings tracked by Average Rent. Prices are refreshed daily.
What is the cheapest apartment rent in Albuquerque, NM?
The lowest available rent in Albuquerque, NM starts at $649 per month. Availability changes daily and prices are refreshed each morning.
How much is a 1-bedroom apartment in Albuquerque, NM?
1-bedroom apartments in Albuquerque, NM average $1,342/mo. The lowest listed 1-bedroom starts at $649/mo across 602 units tracked.
How much is a 2-bedroom apartment in Albuquerque, NM?
2-bedroom apartments in Albuquerque, NM average $1,546/mo. Units start from $778/mo across 672 units currently listed.
Rent Trends in Albuquerque, NM
Track how apartment prices are changing over time.
Missing your neighborhood?
Tell us where you're looking. We'll start tracking prices within 24 hours.
Get Started