Average Rent in Agawam, MA
27 apartment buildings, 37 units. Real asking prices, refreshed daily. 61 more available with Average Rent Pro
Avg Rent
$2,310/mo
market average
Cheapest
$1,138/mo
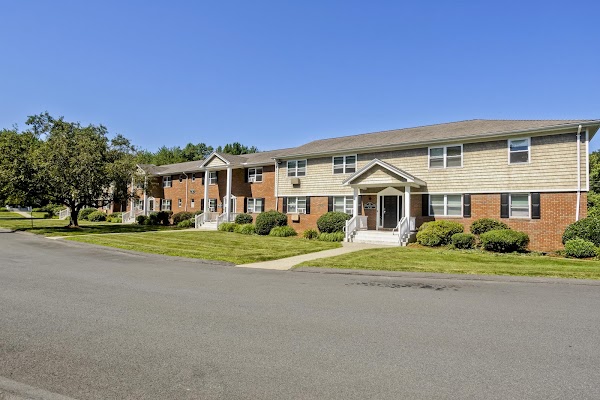
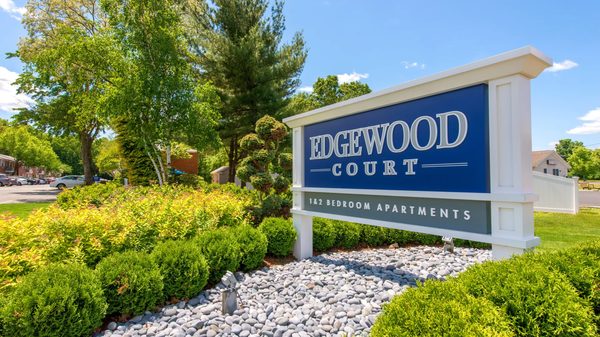
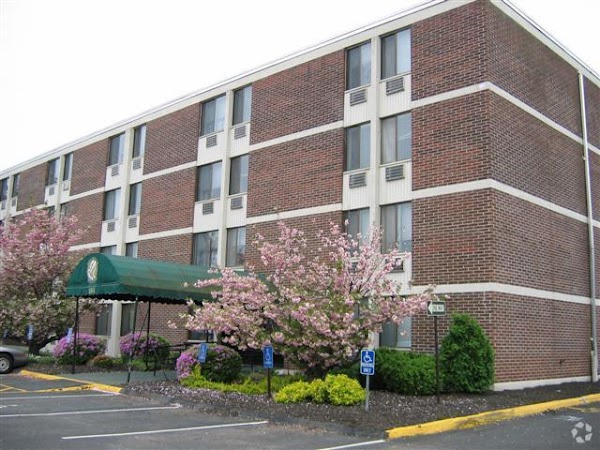
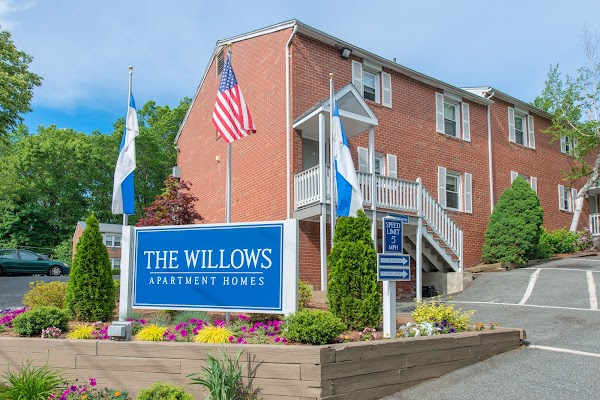
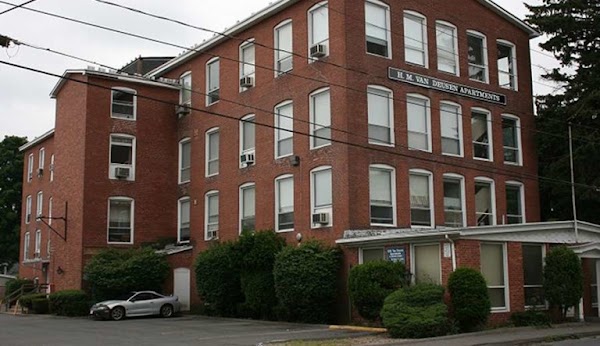
Edgewood Apartments
Properties
27
tracked daily
Units
37
available now
Agawam, MA Resident Access
City Club members share insider gate codes, parking links, and amenity tips.
Analysis
Rent Price Breakdown
Compare pricing across all 27 properties in Agawam, MA.
Average Rent by Property
Starting Price vs Average
Rent by Bedroom Count
Price per Square Foot
Agawam, MA Rent Prices
All 27 properties ranked by lowest available rent.
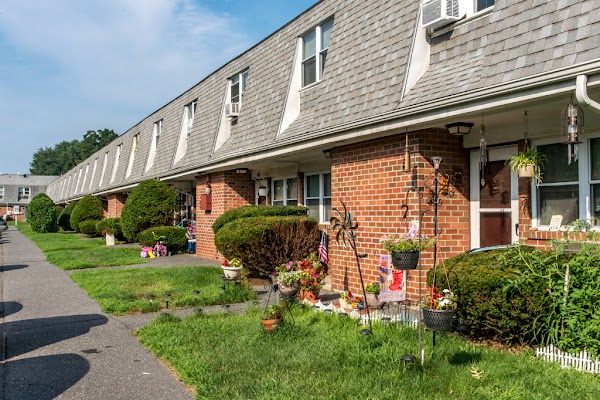
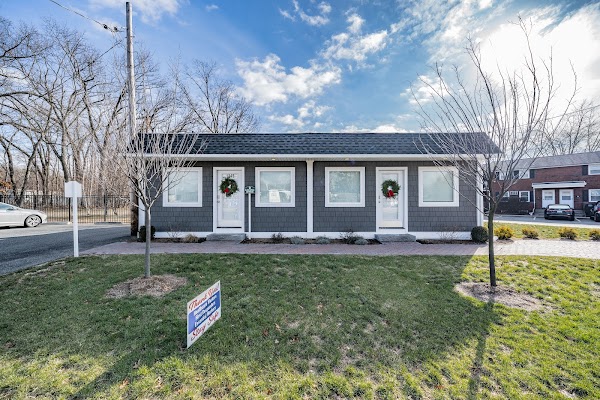
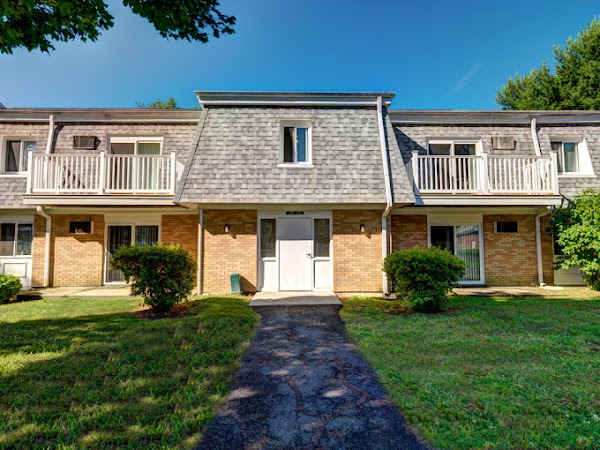
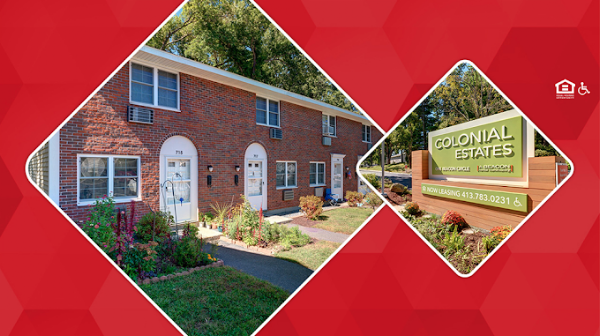
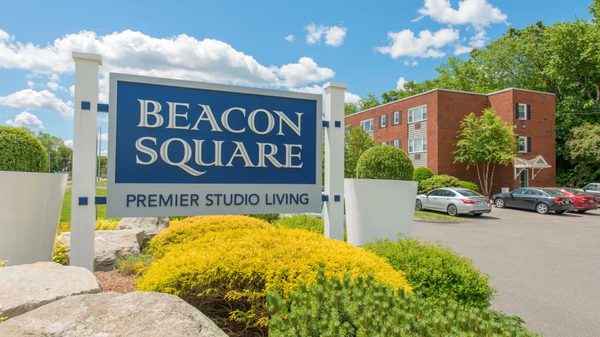
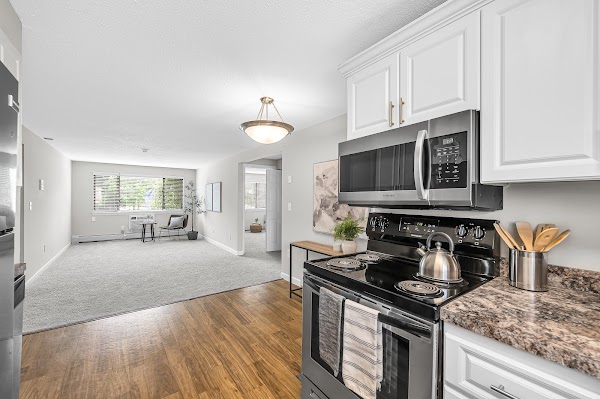
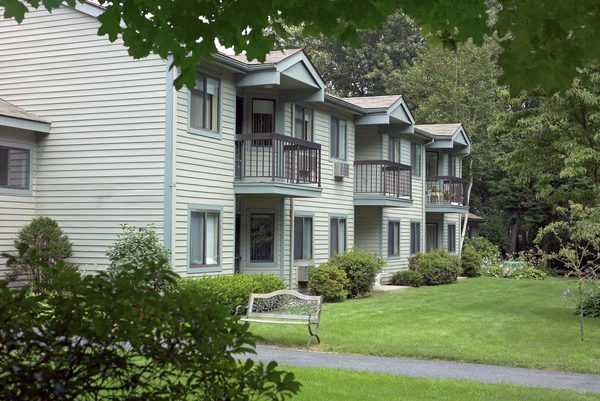
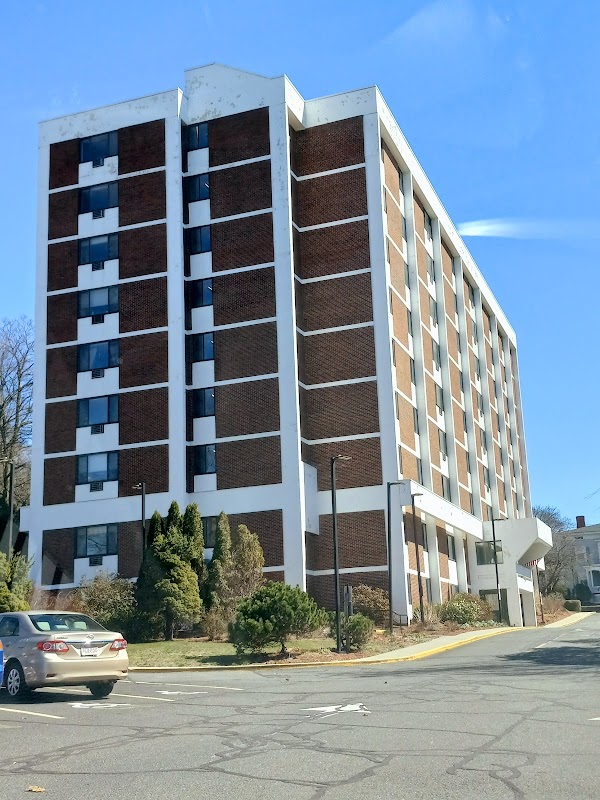
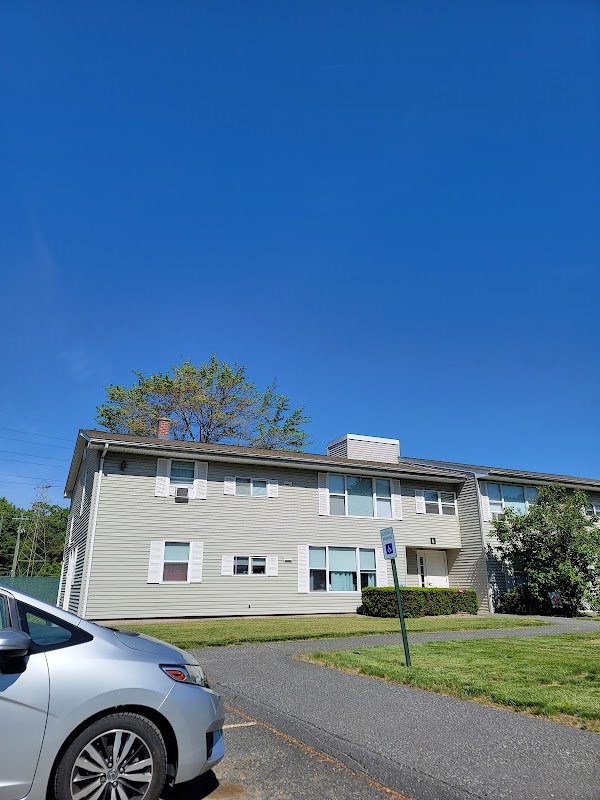
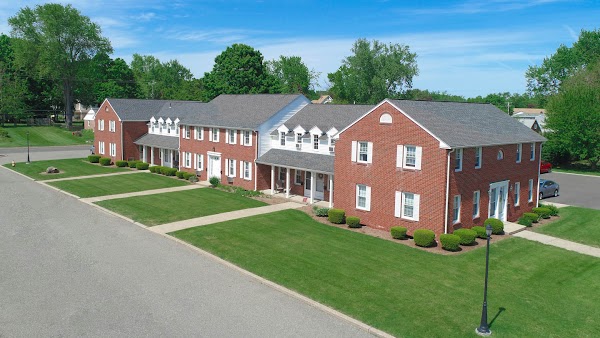
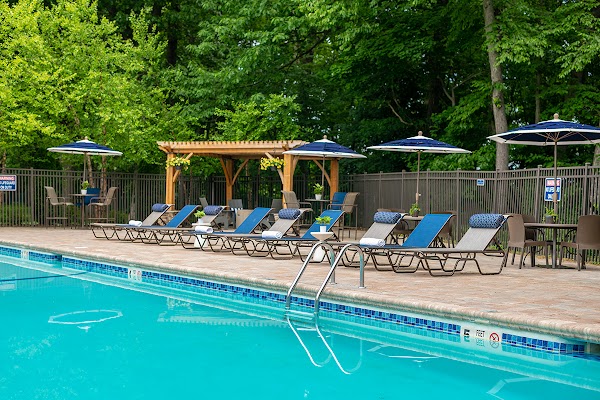
Edgewood Apartments
134 Union St Suite 85, Westfield, MA 01085, USA
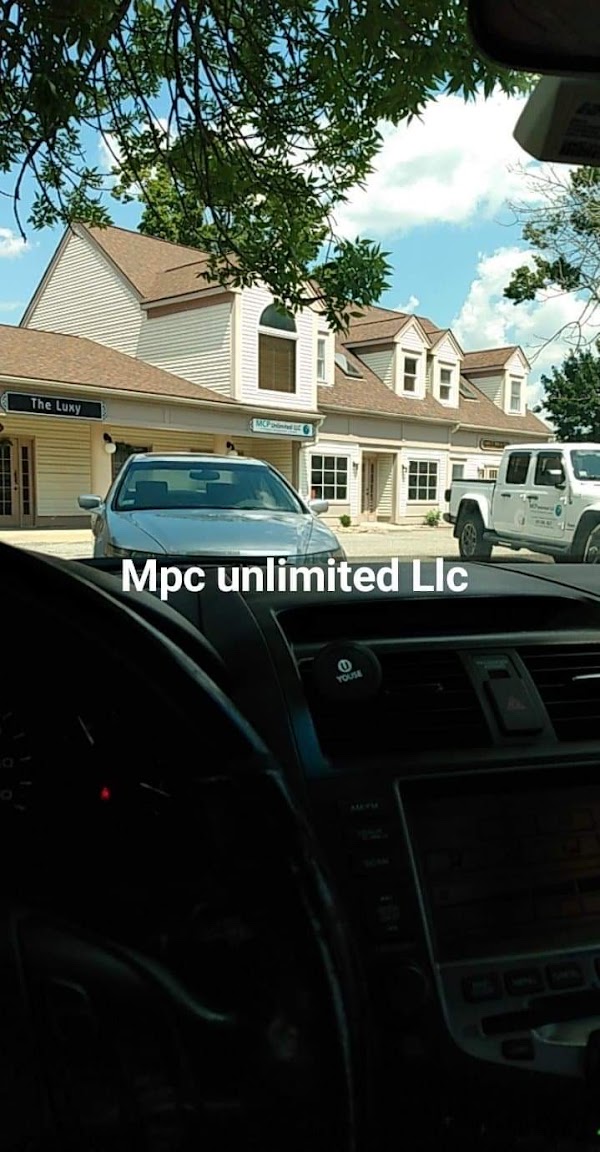
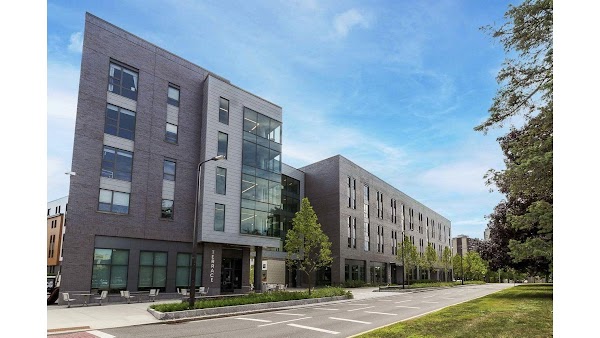
MCP
200 Center St STE 16, Ludlow, MA 01056, USA
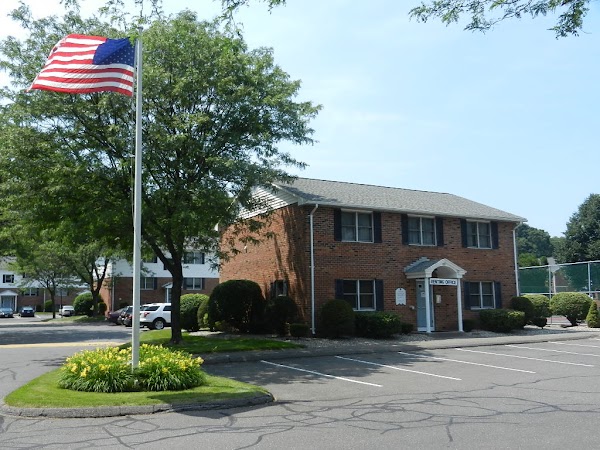
VP Management
62 Suffield St, Agawam, MA 01001, USA
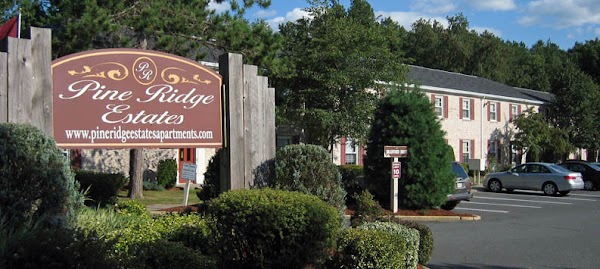
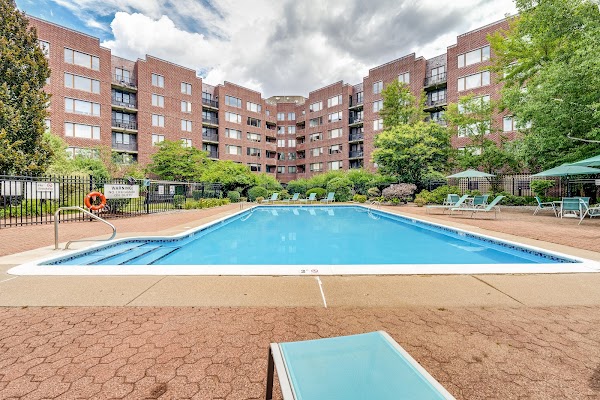
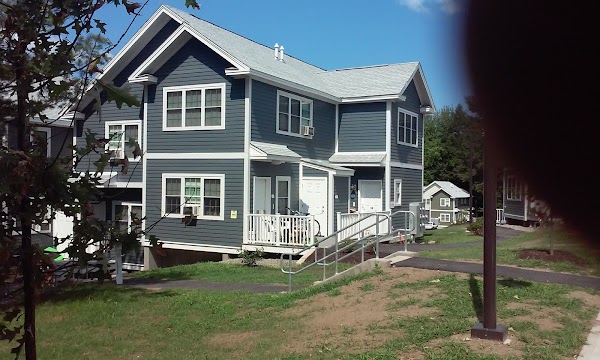
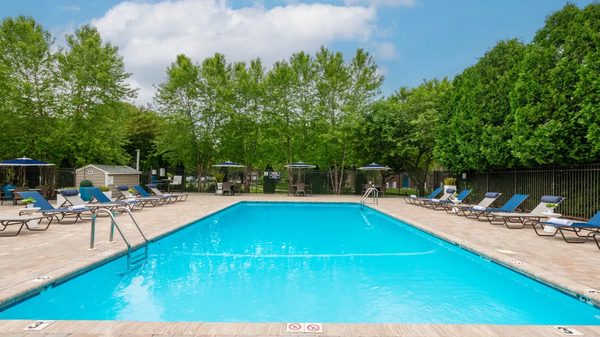
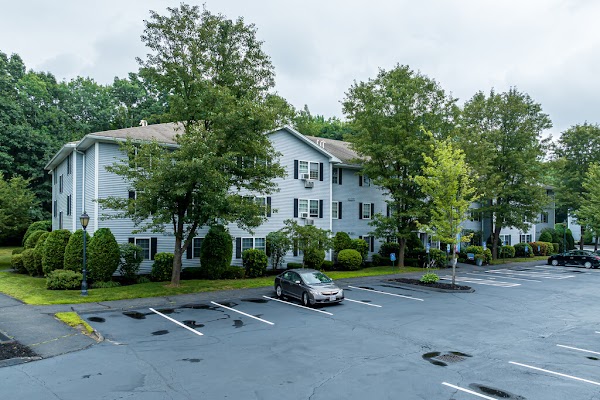
Pine Ridge Estates
19 Bradford Dr, Greenfield, MA 01301, USA
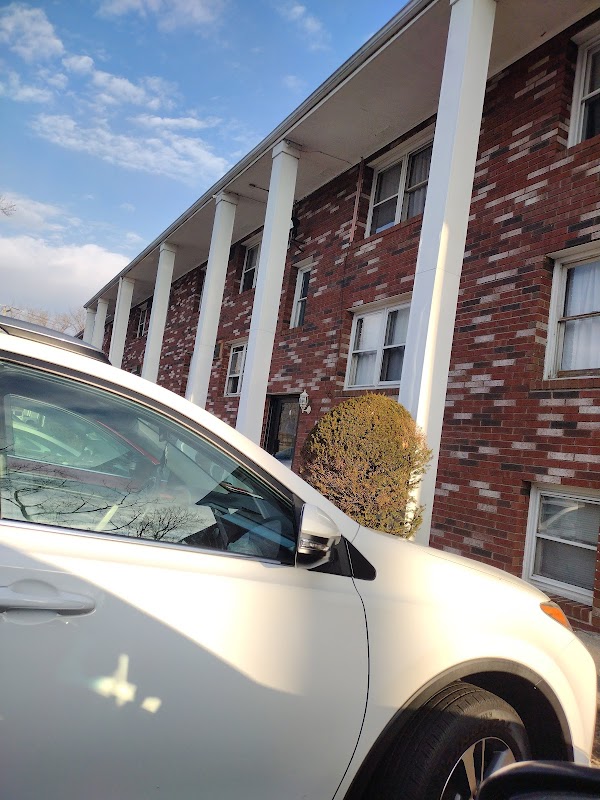
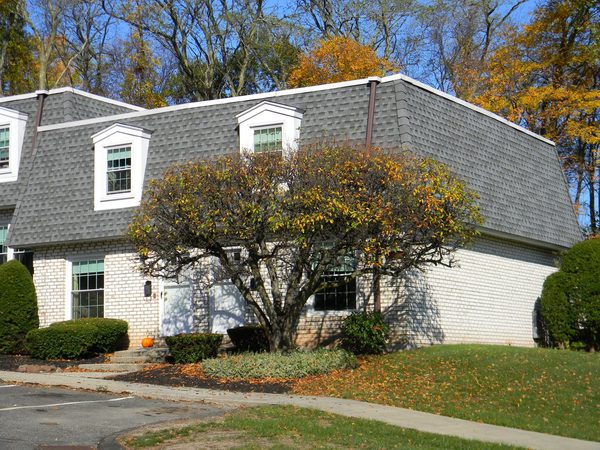
Townhouse Court Apartments
1241 Granby Rd, Chicopee, MA 01020, USA
Park Edge
415 Porter Lake Dr, Springfield, MA 01106, USA
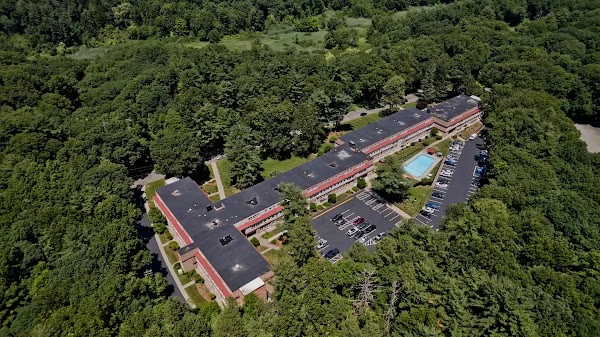
Eastbrook Apartments
259 Fernbank Rd, Springfield, MA 01129, USA
| # | Property | From | Avg | $/sqft | Rating | Units |
|---|---|---|---|---|---|---|
| 1 | Edgewood Apartments 134 Union St Suite 85, Westfield, MA 01085, USA | $1,138 | $1,379 | $1.48 | 4.2 (20) | 3 |
| 2 | MCP 200 Center St STE 16, Ludlow, MA 01056, USA | $1,200 | $1,200 | -- | 3.9 (49) | 1 |
| 3 | VP Management 62 Suffield St, Agawam, MA 01001, USA | $1,200 | $1,200 | -- | 4.7 (423) | 1 |
| 4 | Pine Ridge Estates 19 Bradford Dr, Greenfield, MA 01301, USA | $1,650 | $1,650 | $2.06 | 3.7 (39) | 1 |
| 5 | Townhouse Court Apartments 1241 Granby Rd, Chicopee, MA 01020, USA | $1,650 | $1,773 | $2.45 | 2.3 (8) | 4 |
| 6 | Park Edge 415 Porter Lake Dr, Springfield, MA 01106, USA | $1,820 | $1,820 | $2.02 | 4.4 (7) | 1 |
| 7 | Eastbrook Apartments 259 Fernbank Rd, Springfield, MA 01129, USA | $1,850 | $1,850 | $1.48 | 4 (22) | 1 |
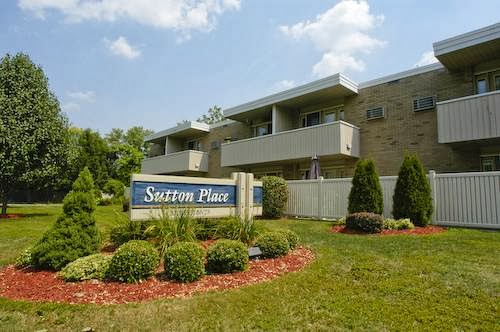
Explore Each Property
Edgewood Apartments
4.2 (20)134 Union St Suite 85, Westfield, MA 01085, USA
MCP
3.9 (49)200 Center St STE 16, Ludlow, MA 01056, USA
VP Management
4.7 (423)62 Suffield St, Agawam, MA 01001, USA
Pine Ridge Estates
3.7 (39)19 Bradford Dr, Greenfield, MA 01301, USA
Townhouse Court Apartments
2.3 (8)1241 Granby Rd, Chicopee, MA 01020, USA
Park Edge
4.4 (7)415 Porter Lake Dr, Springfield, MA 01106, USA


Agawam, MA Average Rent Prices 2026
The average rent in Agawam, MA is $2,310 per month, based on 37 units across 27 apartment communities. Prices range from $1,138 at Edgewood Apartments to $2,195 at North Square Apartments at The Mill District.
Average Rent by Bedroom Type
| Type | Avg Rent | Starting From | Units |
|---|---|---|---|
| 1 Bed | $1,967/mo | $1,200/mo | 12 |
| 2 Bed | $2,184/mo | $1,138/mo | 17 |
| 3 Bed | $3,108/mo | $1,850/mo | 5 |
| 4 Bed | $3,064/mo | $2,082/mo | 3 |
Every price is a real asking rent, updated that morning. Request a neighborhood we don't cover and we add it within 24 hours.
Market Context
Who rents in Agawam, MA, and what they pay
Tracked one-bedroom rent in Agawam, MA averages $1,967/mo, with two-bedroom units averaging $2,184/mo. At the local median household income of $82,359, that works out to 34% of gross income, above the 30 percent affordability ceiling, a stretched-budget market.
The U.S. Census Bureau's American Community Survey 2023 release pegged median gross rent in Agawam, MA at $1,234/mo. The current tracked market average runs 87% higher than that benchmark, reflecting both two to three years of rent growth and the fact that the Census figure covers all renter-occupied housing in Agawam, MA while the tracked market average covers units currently listed in larger apartment communities.
What salary do I need to live comfortably in Agawam, MA?
Built on the 25 to 30 percent rent-to-income guideline used by most landlords and credit-scoring models.
Minimum to afford average rent
$92,000/year
Based on the 30 percent rule, using our tracked average rent of $2,310/mo.
Comfortable income
$111,000/year
Based on the 25 percent rule, leaving more room for savings, transport, and groceries.
To afford the cheapest tracked apartment ($1,138/mo), you need to earn at least $46,000/year.
Median household income in Agawam, MA is $82,359 , about 26% below the comfortable-living threshold.
Cost of living in Agawam, MA
Overall prices in Agawam, MA runs below the national average by about 2% (BEA Regional Price Parity index 98.1, where 100 equals the U.S. average). The breakdown below estimates monthly costs for a single adult, using national consumer-spending baselines from the Bureau of Labor Statistics scaled by Agawam, MA's regional price parities.
| Category | Monthly estimate |
|---|---|
| Rent (market average) | $2,310 |
| Utilities | $338 |
| Groceries | $533 |
| Transportation | $805 |
| Healthcare | $392 |
| Other goods and services | $628 |
| Estimated total | $5,006/mo |
Population
28,510
Median household income
$82,359
Census median rent
$1,234/mo
Rent as % of income
25.5%
Median age
46.1
Mean commute
23 min
Methodology
Rent data
Sourced directly from each tracked apartment community and refreshed every 24 hours. Every listed unit price on this page is real and listed today.
Cost of living
Estimates combine national consumer-spending baselines from the U.S. Bureau of Labor Statistics (Consumer Expenditure Survey) with the U.S. Bureau of Economic Analysis Regional Price Parities (MARPP dataset). Both are peer-reviewed federal data releases published annually.
Salary to live comfortably
Applies the standard 25 to 30 percent rent-to-income rule on top of the listed rent. This is the same affordability guideline used by most landlords and credit-scoring models.
Demographic figures
Median household income, population, median age, commute time, Census median rent, and rent as percentage of income come from the U.S. Census Bureau's American Community Survey 5-year estimates, the most recent complete release.
Cost of living and demographic figures were last published in 2023.
Compare
Nearby cities in Massachusetts
How Agawam, MA rent compares to other markets in the state.
| City | Avg Rent | vs Agawam, MA | Properties |
|---|---|---|---|
| Boston, MA | $4,986 | +116% | 20 |
| Lynn, MA | $2,980 | +29% | 11 |
| Waltham, MA | $3,340 | +45% | 9 |
| Springfield, MA | $1,780 | -23% | 9 |
| Andover, MA | $2,845 | +23% | 8 |
| Lowell, MA | $1,455 | -37% | 7 |
Frequently asked questions
What is the average rent in Agawam, MA?
The average rent in Agawam, MA is $2,310 per month, based on 37 units across 27 apartment buildings tracked by Average Rent. Prices are refreshed daily.
What is the cheapest apartment rent in Agawam, MA?
The lowest available rent in Agawam, MA starts at $1,138 per month. Availability changes daily and prices are refreshed each morning.
How much is a 1-bedroom apartment in Agawam, MA?
1-bedroom apartments in Agawam, MA average $1,967/mo. The lowest listed 1-bedroom starts at $1,200/mo across 12 units tracked.
How much is a 2-bedroom apartment in Agawam, MA?
2-bedroom apartments in Agawam, MA average $2,184/mo. Units start from $1,138/mo across 17 units currently listed.
Rent Trends in Agawam, MA
Track how apartment prices are changing over time.
Missing your neighborhood?
Tell us where you're looking. We'll start tracking prices within 24 hours.
Get Started