Average Rent in Oxnard, CA
10 apartment buildings, 170 units. Daily asking prices with rent history for every building.
Cheapest
$1,437/mo
Holiday Manor
Properties
10
tracked daily
Units
170
available now
Oxnard, CA Resident Access
City Club members share insider gate codes, parking links, and amenity tips.
Analysis
Rent Price Breakdown
Compare pricing across all 10 properties in Oxnard, CA.
Average rent trend, last 2 months
All bedroom types, citywide. Choose a window above to scope the view.
Average Rent by Property
Starting Price vs Average
Rent by Bedroom Count
Price per Square Foot
Oxnard, CA Rent Prices
All 10 properties ranked by lowest available rent.
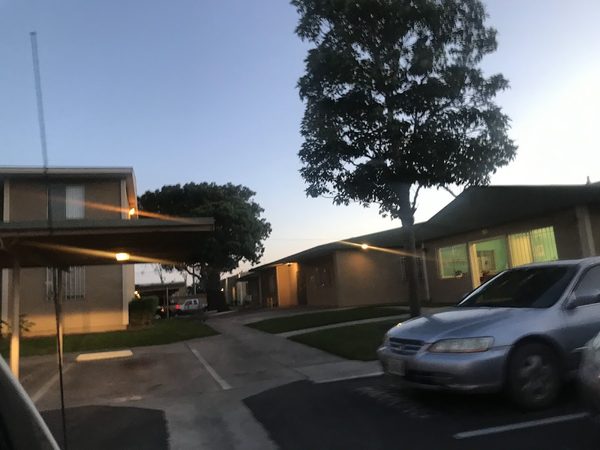
Holiday Manor
1924 Camino Del Sol, Oxnard, CA 93030, USA
The Landing at Channel Islands
3650 Ketch Ave, Oxnard, CA 93035, USA
Coastal Village Apartments
2250 E Pleasant Valley Rd, Oxnard, CA 93033, USA
Tierra Vista Apartments
1750 Montevina Cir, Oxnard, CA 93030, USA
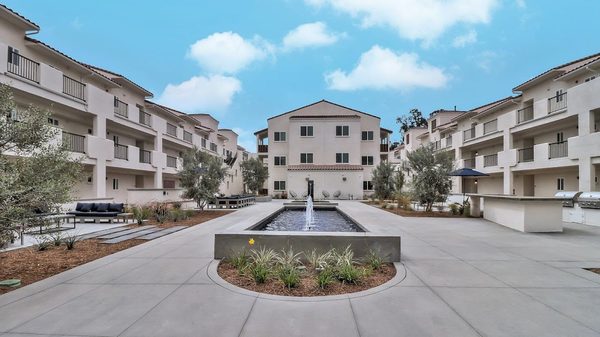
Artisan at East Village Apartments
2060 Zocolo St, Oxnard, CA 93030, USA
Panorama
2700 N Ventura Rd, Oxnard, CA 93036, USA
Mosaic
500 Forest Park Blvd, Oxnard, CA 93036, USA
| # | Property | From | Avg | $/sqft | Rating | Units |
|---|---|---|---|---|---|---|
| 1 | Holiday Manor 1924 Camino Del Sol, Oxnard, CA 93030, USA | $1,437 | $1,838 | $2.36 | 3.6 (34) | 4 |
| 2 | The Landing at Channel Islands 3650 Ketch Ave, Oxnard, CA 93035, USA | $2,190 | $2,469 | $3.49 | 4.3 (92) | 13 |
| 3 | Coastal Village Apartments 2250 E Pleasant Valley Rd, Oxnard, CA 93033, USA | $2,300 | $2,585 | $3.67 | 4.4 (59) | 13 |
| 4 | Tierra Vista Apartments 1750 Montevina Cir, Oxnard, CA 93030, USA | $2,337 | $2,665 | $2.92 | 4 (143) | 22 |
| 5 | Artisan at East Village Apartments 2060 Zocolo St, Oxnard, CA 93030, USA | $2,398 | $2,807 | $3.17 | 3.1 (91) | 14 |
| 6 | Panorama 2700 N Ventura Rd, Oxnard, CA 93036, USA | $2,443 | $3,306 | $3.52 | 4.1 (29) | 61 |
| 7 | Mosaic 500 Forest Park Blvd, Oxnard, CA 93036, USA | $2,456 | $2,742 | $3.62 | 4.6 (242) | 14 |
Rent & Price History by Building
Holiday Manor
3.6 (34)1924 Camino Del Sol, Oxnard, CA 93030, USA
The Landing at Channel Islands
4.3 (92)3650 Ketch Ave, Oxnard, CA 93035, USA
Coastal Village Apartments
4.4 (59)2250 E Pleasant Valley Rd, Oxnard, CA 93033, USA

Tierra Vista Apartments
4 (143)1750 Montevina Cir, Oxnard, CA 93030, USA
Artisan at East Village Apartments
3.1 (91)2060 Zocolo St, Oxnard, CA 93030, USA
Panorama
4.1 (29)2700 N Ventura Rd, Oxnard, CA 93036, USA


By Area
Oxnard, CA neighborhoods
Tracked buildings across 4 named neighborhoods. Pick one to see its apartments.
Oxnard, CA Average Rent Prices 2026
The average rent in Oxnard, CA is $2,981 per month, based on 170 units across 10 apartment communities. Prices range from $1,437 at Holiday Manor to $4,758 at Panorama.
Average Rent by Bedroom Type
| Type | Avg Rent | Starting From | Units |
|---|---|---|---|
| Studio | $2,563/mo | $2,190/mo | 26 |
| 1 Bed | $2,726/mo | $1,437/mo | 76 |
| 2 Bed | $3,278/mo | $1,726/mo | 49 |
| 3 Bed | $3,806/mo | $1,786/mo | 19 |
Every price is a real asking rent, updated that morning. Request a neighborhood we don't cover and we add it within 24 hours.
Market Context
Who rents in Oxnard, CA, and what they pay
Tracked one-bedroom rent in Oxnard, CA averages $2,726/mo, with two-bedroom units averaging $3,278/mo. At the local median household income of $93,372, that works out to 38% of gross income, above the 30 percent affordability ceiling, a stretched-budget market.
The U.S. Census Bureau's American Community Survey 2023 release pegged median gross rent in Oxnard, CA at $1,962/mo. The current tracked market average runs 52% higher than that benchmark, reflecting both two to three years of rent growth and the fact that the Census figure covers all renter-occupied housing in Oxnard, CA while the tracked market average covers units currently listed in larger apartment communities.
What salary do I need to live comfortably in Oxnard, CA?
Built on the 25 to 30 percent rent-to-income guideline used by most landlords and credit-scoring models.
Minimum to afford average rent
$119,000/year
Based on the 30 percent rule, using our tracked average rent of $2,981/mo.
Comfortable income
$143,000/year
Based on the 25 percent rule, leaving more room for savings, transport, and groceries.
To afford the cheapest tracked apartment ($1,437/mo), you need to earn at least $57,000/year.
Median household income in Oxnard, CA is $93,372 , about 35% below the comfortable-living threshold.
Cost of living in Oxnard, CA
Overall prices in Oxnard, CA runs above the national average by about 14% (BEA Regional Price Parity index 113.7, where 100 equals the U.S. average). The breakdown below estimates monthly costs for a single adult, using national consumer-spending baselines from the Bureau of Labor Statistics scaled by Oxnard, CA's regional price parities.
| Category | Monthly estimate |
|---|---|
| Rent (market average) | $2,981 |
| Utilities | $764 |
| Groceries | $567 |
| Transportation | $1,821 |
| Healthcare | $888 |
| Other goods and services | $1,421 |
| Estimated total | $8,441/mo |
Population
201,014
Median household income
$93,372
Census median rent
$1,962/mo
Rent as % of income
34.0%
Median age
34.0
Mean commute
25 min
Methodology
Rent data
Sourced directly from each tracked apartment community and refreshed every 24 hours. Every listed unit price on this page is real and listed today.
Cost of living
Estimates combine national consumer-spending baselines from the U.S. Bureau of Labor Statistics (Consumer Expenditure Survey) with the U.S. Bureau of Economic Analysis Regional Price Parities (MARPP dataset). Both are peer-reviewed federal data releases published annually.
Salary to live comfortably
Applies the standard 25 to 30 percent rent-to-income rule on top of the listed rent. This is the same affordability guideline used by most landlords and credit-scoring models.
Demographic figures
Median household income, population, median age, commute time, Census median rent, and rent as percentage of income come from the U.S. Census Bureau's American Community Survey 5-year estimates, the most recent complete release.
Cost of living and demographic figures were last published in 2023.
Compare
Nearby cities in California
How Oxnard, CA rent compares to other markets in the state.
| City | Avg Rent | vs Oxnard, CA | 30-Day Change | Properties |
|---|---|---|---|---|
| Los Angeles, CA | $2,940 | -1% | +2.9% | 49 |
| Anaheim, CA | $2,841 | -5% | -1.4% | 32 |
| San Diego, CA | $3,330 | +12% | -1.9% | 30 |
| Riverside, CA | $2,534 | -15% | -2.4% | 26 |
| Oakland, CA | $3,639 | +22% | +1.4% | 22 |
| Sacramento, CA | $2,371 | -20% | -0.6% | 22 |
Frequently asked questions
What is the average rent in Oxnard, CA?
The average rent in Oxnard, CA is $2,981 per month, based on 170 units across 10 apartment buildings tracked by Average Rent. Prices are refreshed daily.
What is the median rent in Oxnard, CA?
The median asking rent in Oxnard, CA is $2,817 per month, computed from 170 live listed units and refreshed daily. The average is $2,981/mo; the median resists skew from luxury listings.
What is the cheapest apartment rent in Oxnard, CA?
The lowest available rent in Oxnard, CA starts at $1,437 per month. Availability changes daily and prices are refreshed each morning.
How much is a 1-bedroom apartment in Oxnard, CA?
1-bedroom apartments in Oxnard, CA average $2,726/mo. The lowest listed 1-bedroom starts at $1,437/mo across 76 units tracked.
How much is a 2-bedroom apartment in Oxnard, CA?
2-bedroom apartments in Oxnard, CA average $3,278/mo. Units start from $1,726/mo across 49 units currently listed.
Rent Trends in Oxnard, CA
Track how apartment prices are changing over time.
Missing your neighborhood?
Tell us where you're looking. We'll start tracking prices within 24 hours.
Get Started