Average Rent in Murrieta, CA
12 apartment buildings, 277 units. Real asking prices, refreshed daily.
Avg Rent
$2,740/mo
market average
Cheapest
$1,000/mo
Delhaven Pointe Apartments
Properties
12
tracked daily
Units
277
available now
Murrieta, CA Resident Access
City Club members share insider gate codes, parking links, and amenity tips.
Analysis
Rent Price Breakdown
Compare pricing across all 12 properties in Murrieta, CA.
Average Rent by Property
Starting Price vs Average
Rent by Bedroom Count
Price per Square Foot
Murrieta, CA Rent Prices
All 12 properties ranked by lowest available rent.
Delhaven Pointe Apartments
39261 Delhaven St, Murrieta, CA 92563, USA
Magnum Realty Group - Property Management
41870 Kalmia St STE 165, Murrieta, CA 92562, USA
55+ FountainGlen Temecula
27250 Nicolas Rd, Temecula, CA 92591, USA
Vista Promenade
29605 Solana Way, Temecula, CA 92591, USA
Oak Springs Ranch
24055 Clinton Keith Rd, Wildomar, CA 92595, USA
Solana Ridge
41754 Margarita Rd, Temecula, CA 92591, USA
Gables Alta Murrieta
39930 Whitewood Rd, Murrieta, CA 92563, USA
| # | Property | From | Avg | $/sqft | Rating | Units |
|---|---|---|---|---|---|---|
| 1 | Delhaven Pointe Apartments 39261 Delhaven St, Murrieta, CA 92563, USA | $1,000 | $1,000 | $1.63 | 4.8 (109) | 1 |
| 2 | Magnum Realty Group - Property Management 41870 Kalmia St STE 165, Murrieta, CA 92562, USA | $1,799 | $2,508 | $1.70 | 4.8 (180) | 3 |
| 3 | 55+ FountainGlen Temecula 27250 Nicolas Rd, Temecula, CA 92591, USA | $1,800 | $2,071 | $3.00 | 4.7 (165) | 15 |
| 4 | Vista Promenade 29605 Solana Way, Temecula, CA 92591, USA | $2,020 | $2,213 | $2.72 | 3.8 (299) | 10 |
| 5 | Oak Springs Ranch 24055 Clinton Keith Rd, Wildomar, CA 92595, USA | $2,077 | $2,782 | $2.37 | 4.1 (154) | 13 |
| 6 | Solana Ridge 41754 Margarita Rd, Temecula, CA 92591, USA | $2,151 | $2,308 | $2.28 | 4.2 (242) | 3 |
| 7 | Gables Alta Murrieta 39930 Whitewood Rd, Murrieta, CA 92563, USA | $2,301 | $2,416 | $2.38 | 4.2 (89) | 11 |
Explore Each Property
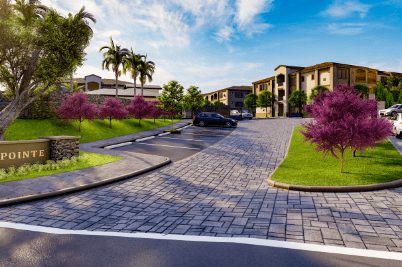
Delhaven Pointe Apartments
4.8 (109)39261 Delhaven St, Murrieta, CA 92563, USA

Magnum Realty Group - Property Management
4.8 (180)41870 Kalmia St STE 165, Murrieta, CA 92562, USA
55+ FountainGlen Temecula
4.7 (165)27250 Nicolas Rd, Temecula, CA 92591, USA
Vista Promenade
3.8 (299)29605 Solana Way, Temecula, CA 92591, USA
Oak Springs Ranch
4.1 (154)24055 Clinton Keith Rd, Wildomar, CA 92595, USA
Solana Ridge
4.2 (242)41754 Margarita Rd, Temecula, CA 92591, USA

Murrieta, CA Average Rent Prices 2026
The average rent in Murrieta, CA is $2,740 per month, based on 277 units across 12 apartment communities. Prices range from $1,000 at Delhaven Pointe Apartments to $2,495 at Jensen Property Management.
Average Rent by Bedroom Type
| Type | Avg Rent | Starting From | Units |
|---|---|---|---|
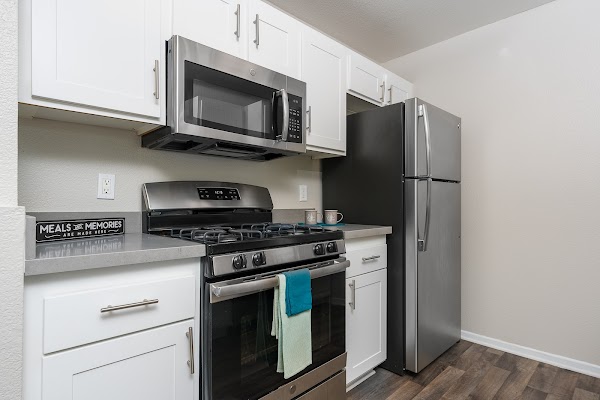
| 1 Bed | $2,450/mo | $1,000/mo | 103 |
| 2 Bed | $2,849/mo | $1,800/mo | 156 |
| 3 Bed | $3,464/mo | $2,700/mo | 17 |
| 4 Bed | $3,250/mo | $3,250/mo | 1 |
Every price is a real asking rent, updated that morning. Request a neighborhood we don't cover and we add it within 24 hours.
Market Context
Who rents in Murrieta, CA, and what they pay
Tracked one-bedroom rent in Murrieta, CA averages $2,450/mo, with two-bedroom units averaging $2,849/mo. At the local median household income of $109,780, that works out to 30% of gross income, near the 30 percent affordability ceiling.
The U.S. Census Bureau's American Community Survey 2023 release pegged median gross rent in Murrieta, CA at $2,330/mo. The current tracked market average runs 18% higher than that benchmark, reflecting both two to three years of rent growth and the fact that the Census figure covers all renter-occupied housing in Murrieta, CA while the tracked market average covers units currently listed in larger apartment communities.
What salary do I need to live comfortably in Murrieta, CA?
Built on the 25 to 30 percent rent-to-income guideline used by most landlords and credit-scoring models.
Minimum to afford average rent
$110,000/year
Based on the 30 percent rule, using our tracked average rent of $2,740/mo.
Comfortable income
$132,000/year
Based on the 25 percent rule, leaving more room for savings, transport, and groceries.
To afford the cheapest tracked apartment ($1,000/mo), you need to earn at least $40,000/year.
Median household income in Murrieta, CA is $109,780 , about 17% below the comfortable-living threshold.
Cost of living in Murrieta, CA
Overall prices in Murrieta, CA runs above the national average by about 7% (BEA Regional Price Parity index 107.3, where 100 equals the U.S. average). The breakdown below estimates monthly costs for a single adult, using national consumer-spending baselines from the Bureau of Labor Statistics scaled by Murrieta, CA's regional price parities.
| Category | Monthly estimate |
|---|---|
| Rent (market average) | $2,740 |
| Utilities | $567 |
| Groceries | $551 |
| Transportation | $1,353 |
| Healthcare | $660 |
| Other goods and services | $1,056 |
| Estimated total | $6,926/mo |
Population
111,621
Median household income
$109,780
Census median rent
$2,330/mo
Rent as % of income
33.4%
Median age
36.0
Mean commute
37 min
Methodology
Rent data
Sourced directly from each tracked apartment community and refreshed every 24 hours. Every listed unit price on this page is real and listed today.
Cost of living
Estimates combine national consumer-spending baselines from the U.S. Bureau of Labor Statistics (Consumer Expenditure Survey) with the U.S. Bureau of Economic Analysis Regional Price Parities (MARPP dataset). Both are peer-reviewed federal data releases published annually.
Salary to live comfortably
Applies the standard 25 to 30 percent rent-to-income rule on top of the listed rent. This is the same affordability guideline used by most landlords and credit-scoring models.
Demographic figures
Median household income, population, median age, commute time, Census median rent, and rent as percentage of income come from the U.S. Census Bureau's American Community Survey 5-year estimates, the most recent complete release.
Cost of living and demographic figures were last published in 2023.
Compare
Nearby cities in California
How Murrieta, CA rent compares to other markets in the state.
| City | Avg Rent | vs Murrieta, CA | Properties |
|---|---|---|---|
| Los Angeles, CA | $2,876 | +5% | 35 |
| Anaheim, CA | $2,813 | +3% | 28 |
| San Diego, CA | $3,300 | +20% | 24 |
| Sacramento, CA | $2,356 | -14% | 24 |
| Riverside, CA | $2,567 | -6% | 24 |
| Antioch, CA | $2,329 | -15% | 21 |
Frequently asked questions
What is the average rent in Murrieta, CA?
The average rent in Murrieta, CA is $2,740 per month, based on 277 units across 12 apartment buildings tracked by Average Rent. Prices are refreshed daily.
What is the cheapest apartment rent in Murrieta, CA?
The lowest available rent in Murrieta, CA starts at $1,000 per month. Availability changes daily and prices are refreshed each morning.
How much is a 1-bedroom apartment in Murrieta, CA?
1-bedroom apartments in Murrieta, CA average $2,450/mo. The lowest listed 1-bedroom starts at $1,000/mo across 103 units tracked.
How much is a 2-bedroom apartment in Murrieta, CA?
2-bedroom apartments in Murrieta, CA average $2,849/mo. Units start from $1,800/mo across 156 units currently listed.
Rent Trends in Murrieta, CA
Track how apartment prices are changing over time.
Missing your neighborhood?
Tell us where you're looking. We'll start tracking prices within 24 hours.
Get Started