Average Rent in Chino Hills, CA
11 apartment buildings, 109 units. Daily asking prices with rent history for every building.
Cheapest
$2,095/mo
Enclave at Town Square
Properties
11
tracked daily
Units
109
available now
Chino Hills, CA Resident Access
City Club members share insider gate codes, parking links, and amenity tips.
Analysis
Rent Price Breakdown
Compare pricing across all 11 properties in Chino Hills, CA.
Average rent trend, last 2 months
All bedroom types, citywide. Choose a window above to scope the view.
Average Rent by Property
Starting Price vs Average
Rent by Bedroom Count
Price per Square Foot
Chino Hills, CA Rent Prices
All 11 properties ranked by lowest available rent.
Enclave at Town Square
11475 Central Ave, Chino, CA 91710, USA
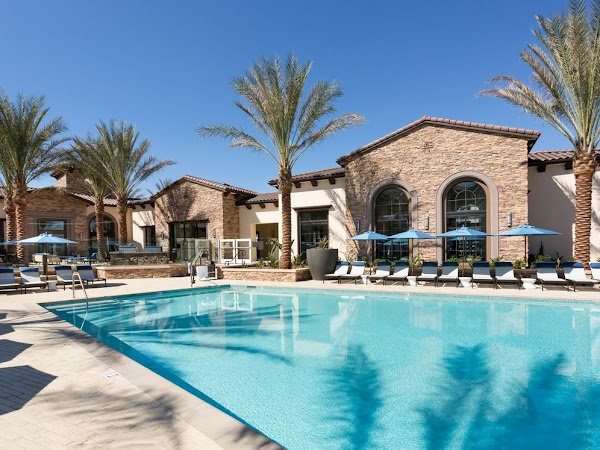
Reserve at Chino Hills
4200 Village Dr, Chino Hills, CA 91709, USA
The Summit at Chino Hills
2400 Ridgeview Dr, Chino Hills, CA 91709, USA
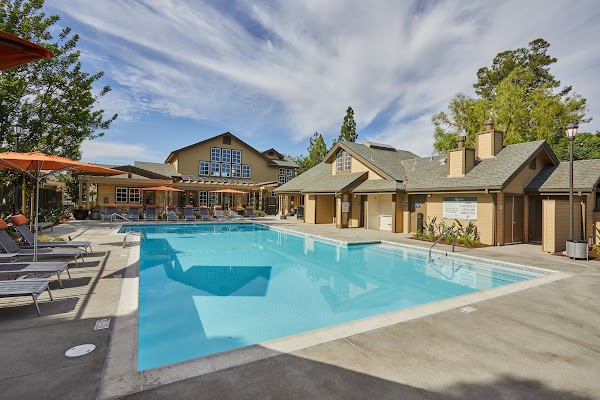
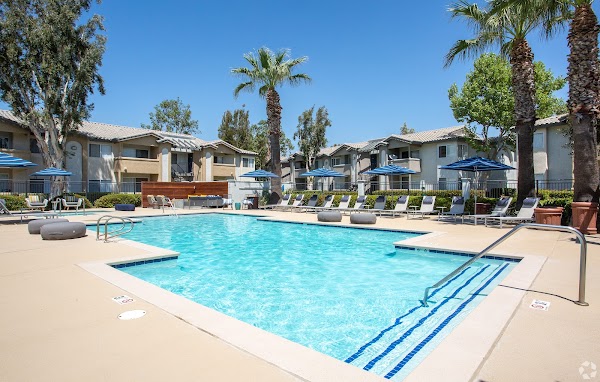
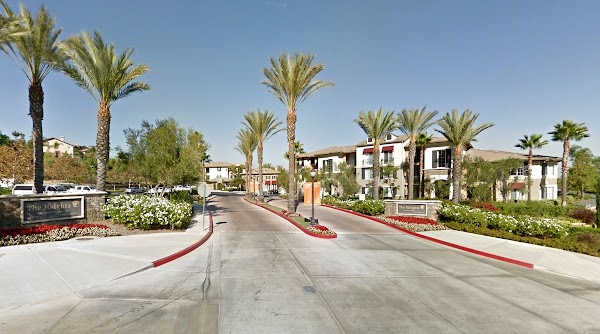
The Heights at Chino Hills
16675 Slate Dr, Chino Hills, CA 91709, USA
Avalon Chino Hills
5685 Park Dr, Chino Hills, CA 91709, USA
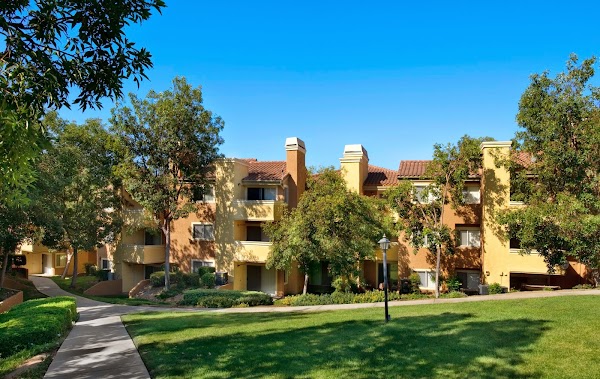
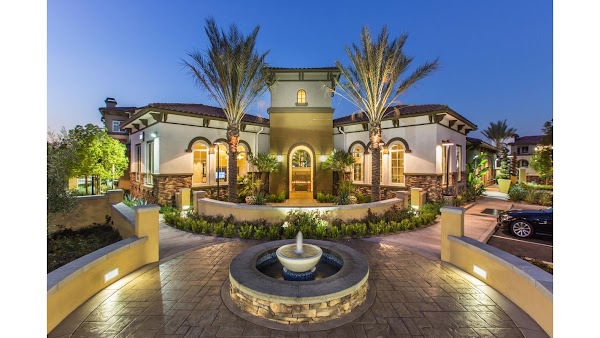
Green Valley Apartments
14901 Frost Ave, Chino Hills, CA 91709, USA
eaves Phillips Ranch
400 Appian Way, Pomona, CA 91766, USA
| # | Property | From | Avg | $/sqft | Rating | Units |
|---|---|---|---|---|---|---|
| 1 | Enclave at Town Square 11475 Central Ave, Chino, CA 91710, USA | $2,095 | $2,349 | $3.16 | 3.5 (32) | 6 |
| 2 | Reserve at Chino Hills 4200 Village Dr, Chino Hills, CA 91709, USA | $2,316 | $2,593 | $3.55 | 4.1 (245) | 14 |
| 3 | The Summit at Chino Hills 2400 Ridgeview Dr, Chino Hills, CA 91709, USA | $2,340 | $2,495 | $3.34 | 4.1 (69) | 3 |
| 4 | The Heights at Chino Hills 16675 Slate Dr, Chino Hills, CA 91709, USA | $2,344 | $2,794 | $2.92 | 4.1 (76) | 8 |
| 5 | Avalon Chino Hills 5685 Park Dr, Chino Hills, CA 91709, USA | $2,465 | $2,895 | $3.00 | 4.6 (246) | 15 |
| 6 | Green Valley Apartments 14901 Frost Ave, Chino Hills, CA 91709, USA | $2,472 | $2,916 | $3.16 | 4.3 (73) | 6 |
| 7 | eaves Phillips Ranch 400 Appian Way, Pomona, CA 91766, USA | $2,540 | $2,800 | $2.83 | 4.2 (324) | 26 |
Rent & Price History by Building

Enclave at Town Square
3.5 (32)11475 Central Ave, Chino, CA 91710, USA
Reserve at Chino Hills
4.1 (245)4200 Village Dr, Chino Hills, CA 91709, USA
The Summit at Chino Hills
4.1 (69)2400 Ridgeview Dr, Chino Hills, CA 91709, USA
The Heights at Chino Hills
4.1 (76)16675 Slate Dr, Chino Hills, CA 91709, USA
Avalon Chino Hills
4.6 (246)5685 Park Dr, Chino Hills, CA 91709, USA
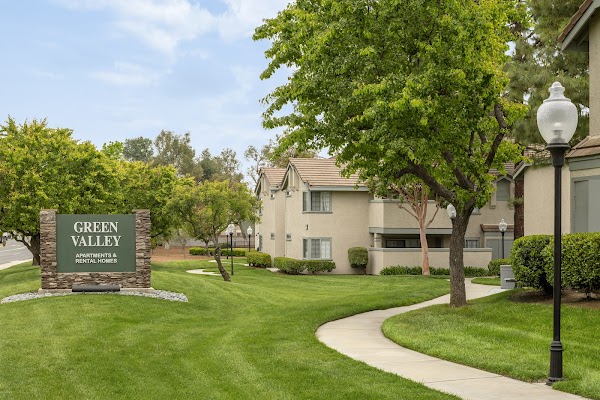
Green Valley Apartments
4.3 (73)14901 Frost Ave, Chino Hills, CA 91709, USA


By Area
Chino Hills, CA neighborhoods
Tracked buildings across 3 named neighborhoods. Pick one to see its apartments.
Chino Hills, CA Average Rent Prices 2026
The average rent in Chino Hills, CA is $2,774 per month, based on 109 units across 11 apartment communities. Prices range from $2,095 at Enclave at Town Square to $3,696 at Reserve at Chino Hills.
Average Rent by Bedroom Type
| Type | Avg Rent | Starting From | Units |
|---|---|---|---|
| Studio | $2,336/mo | $2,316/mo | 3 |
| 1 Bed | $2,514/mo | $2,095/mo | 36 |
| 2 Bed | $2,905/mo | $2,540/mo | 68 |
| 3 Bed | $3,673/mo | $3,649/mo | 2 |
Every price is a real asking rent, updated that morning. Request a neighborhood we don't cover and we add it within 24 hours.
What salary do I need to live comfortably in Chino Hills, CA?
Built on the 25 to 30 percent rent-to-income guideline used by most landlords and credit-scoring models.
Minimum to afford average rent
$111,000/year
Based on the 30 percent rule, using our tracked average rent of $2,774/mo.
Comfortable income
$133,000/year
Based on the 25 percent rule, leaving more room for savings, transport, and groceries.
To afford the cheapest tracked apartment ($2,095/mo), you need to earn at least $84,000/year.
Cost of living in Chino Hills, CA
We only have live rent data for Chino Hills, CA so far. The full cost of living breakdown (utilities, groceries, transportation, healthcare) is coming soon.
| Category | Monthly estimate |
|---|---|
| Rent (market average) | $2,774 |
| Estimated total | $2,774/mo |
Methodology
Rent data
Sourced directly from each tracked apartment community and refreshed every 24 hours. Every listed unit price on this page is real and listed today.
Cost of living
Estimates combine national consumer-spending baselines from the U.S. Bureau of Labor Statistics (Consumer Expenditure Survey) with the U.S. Bureau of Economic Analysis Regional Price Parities (MARPP dataset). Both are peer-reviewed federal data releases published annually.
Salary to live comfortably
Applies the standard 25 to 30 percent rent-to-income rule on top of the listed rent. This is the same affordability guideline used by most landlords and credit-scoring models.
Demographic figures
Median household income, population, median age, commute time, Census median rent, and rent as percentage of income come from the U.S. Census Bureau's American Community Survey 5-year estimates, the most recent complete release.
Cost of living and demographic figures are refreshed annually.
Compare
Nearby cities in California
How Chino Hills, CA rent compares to other markets in the state.
| City | Avg Rent | vs Chino Hills, CA | 30-Day Change | Properties |
|---|---|---|---|---|
| Los Angeles, CA | $2,940 | +6% | +2.2% | 49 |
| Anaheim, CA | $2,841 | +2% | -1.6% | 32 |
| San Diego, CA | $3,337 | +20% | -3.1% | 30 |
| Riverside, CA | $2,534 | -9% | -0.4% | 26 |
| Oakland, CA | $3,639 | +31% | +1.2% | 22 |
| Sacramento, CA | $2,371 | -15% | -3.6% | 22 |
Frequently asked questions
What is the average rent in Chino Hills, CA?
The average rent in Chino Hills, CA is $2,774 per month, based on 109 units across 11 apartment buildings tracked by Average Rent. Prices are refreshed daily.
What is the median rent in Chino Hills, CA?
The median asking rent in Chino Hills, CA is $2,760 per month, computed from 109 live listed units and refreshed daily. The average is $2,774/mo; the median resists skew from luxury listings.
What is the cheapest apartment rent in Chino Hills, CA?
The lowest available rent in Chino Hills, CA starts at $2,095 per month. Availability changes daily and prices are refreshed each morning.
How much is a 1-bedroom apartment in Chino Hills, CA?
1-bedroom apartments in Chino Hills, CA average $2,514/mo. The lowest listed 1-bedroom starts at $2,095/mo across 36 units tracked.
How much is a 2-bedroom apartment in Chino Hills, CA?
2-bedroom apartments in Chino Hills, CA average $2,905/mo. Units start from $2,540/mo across 68 units currently listed.
Rent Trends in Chino Hills, CA
Track how apartment prices are changing over time.
Missing your neighborhood?
Tell us where you're looking. We'll start tracking prices within 24 hours.
Get Started