Average Rent in Avondale, AZ
15 apartment buildings, 378 units. Real asking prices, refreshed daily.
Avg Rent
$1,743/mo
market average
Cheapest
$1,168/mo
Ashton Pointe
Properties
15
tracked daily
Units
378
available now
Avondale, AZ Resident Access
City Club members share insider gate codes, parking links, and amenity tips.
Analysis
Rent Price Breakdown
Compare pricing across all 15 properties in Avondale, AZ.
Average Rent by Property
Starting Price vs Average
Rent by Bedroom Count
Price per Square Foot
Avondale, AZ Rent Prices
All 15 properties ranked by lowest available rent.
Ashton Pointe
12175 W McDowell Rd, Avondale, AZ 85392, USA
Harmony at Hurley Farms
2929 S 91st Ave, Tolleson, AZ 85353, USA
The Stately Avondale
12375 W Van Buren St, Avondale, AZ 85323, USA
Bella Mirage
3800 N El Mirage Rd, Avondale, AZ 85392, USA
Alta Avondale
11330 W Van Buren St, Avondale, AZ 85323, USA
Radia Avondale Station
9975 W Encanto Blvd, Avondale, AZ 85392, USA
Parc Lofts
8727 W McDowell Rd, Tolleson, AZ 85353, USA
| # | Property | From | Avg | $/sqft | Rating | Units |
|---|---|---|---|---|---|---|
| 1 | Ashton Pointe 12175 W McDowell Rd, Avondale, AZ 85392, USA | $1,168 | $1,446 | $1.47 | 3.5 (204) | 15 |
| 2 | Harmony at Hurley Farms 2929 S 91st Ave, Tolleson, AZ 85353, USA | $1,259 | $1,259 | -- | 4.5 (37) | 1 |
| 3 | The Stately Avondale 12375 W Van Buren St, Avondale, AZ 85323, USA | $1,272 | $1,798 | $1.84 | 5 (22) | 114 |
| 4 | Bella Mirage 3800 N El Mirage Rd, Avondale, AZ 85392, USA | $1,274 | $1,644 | $1.62 | 3.5 (470) | 66 |
| 5 | Alta Avondale 11330 W Van Buren St, Avondale, AZ 85323, USA | $1,295 | $1,708 | $1.75 | 4.5 (100) | 78 |
| 6 | Radia Avondale Station 9975 W Encanto Blvd, Avondale, AZ 85392, USA | $1,325 | $1,748 | $1.74 | 4.7 (78) | 8 |
| 7 | Parc Lofts 8727 W McDowell Rd, Tolleson, AZ 85353, USA | $1,357 | $1,582 | $1.64 | 4.1 (106) | 4 |
Explore Each Property
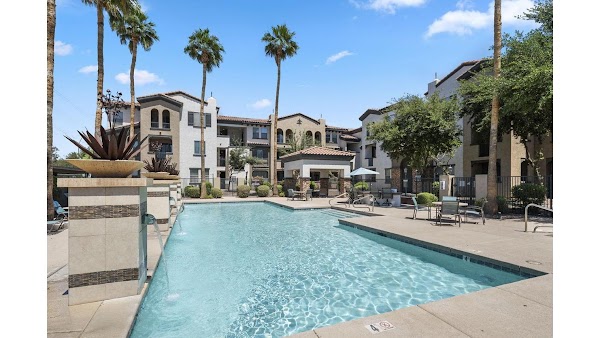
Ashton Pointe
3.5 (204)12175 W McDowell Rd, Avondale, AZ 85392, USA
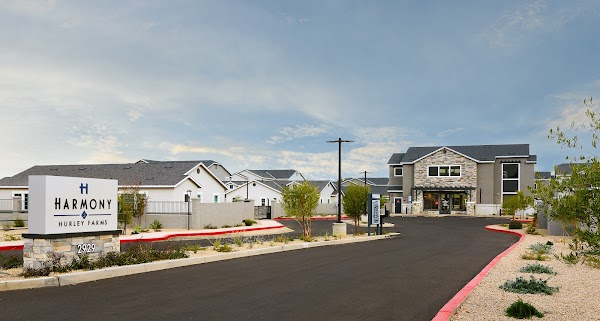
Harmony at Hurley Farms
4.5 (37)2929 S 91st Ave, Tolleson, AZ 85353, USA
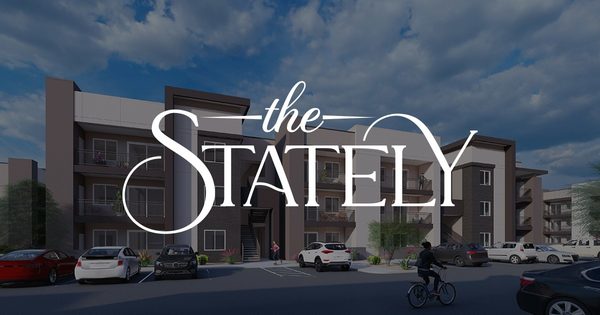
The Stately Avondale
5 (22)12375 W Van Buren St, Avondale, AZ 85323, USA
Bella Mirage
3.5 (470)3800 N El Mirage Rd, Avondale, AZ 85392, USA
Alta Avondale
4.5 (100)11330 W Van Buren St, Avondale, AZ 85323, USA
Radia Avondale Station
4.7 (78)9975 W Encanto Blvd, Avondale, AZ 85392, USA

Avondale, AZ Average Rent Prices 2026
The average rent in Avondale, AZ is $1,743 per month, based on 378 units across 15 apartment communities. Prices range from $1,168 at Ashton Pointe to $2,399 at Ironwood Homes at River Run.
Average Rent by Bedroom Type
| Type | Avg Rent | Starting From | Units |
|---|---|---|---|
| Studio | $1,347/mo | $1,259/mo | 4 |
| 1 Bed | $1,544/mo | $1,168/mo | 154 |
| 2 Bed | $1,771/mo | $1,394/mo | 156 |
| 3 Bed | $2,176/mo | $1,678/mo | 64 |
Every price is a real asking rent, updated that morning. Request a neighborhood we don't cover and we add it within 24 hours.
Building Economics
How much do Avondale, AZ apartments earn?
The 12 buildings we can estimate generate about $2.8M in rental revenue per month ($34M a year). Estimated from each building's unit-level listing and leasing activity.
| Building | Est. Monthly Revenue | Est. Occupancy | Units |
|---|---|---|---|
| 1.Bella Mirage | $720K/mo | 89% | 594 |
| 2.Alta Avondale | $460K/mo | 78% | 360 |
| 3.Avilla Western Garden | $363K/mo | 83% | 234 |
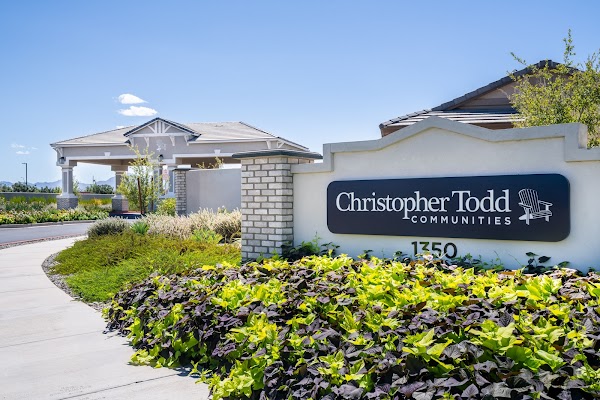
| 4.Christopher Todd Communities at McDowell | $329K/mo | 94% | 215 |
| 5.The Stately Avondale | $311K/mo | 60% | 286 |
Research estimates from listing activity, not operator financials. Click any building for the full revenue breakdown and methodology.
Market Context
Who rents in Avondale, AZ, and what they pay
Tracked one-bedroom rent in Avondale, AZ averages $1,544/mo, with two-bedroom units averaging $1,771/mo. At the local median household income of $81,260, that works out to 26% of gross income, near the 30 percent affordability ceiling.
The U.S. Census Bureau's American Community Survey 2023 release pegged median gross rent in Avondale, AZ at $1,731/mo. The current tracked market average runs 1% higher than that benchmark, reflecting both two to three years of rent growth and the fact that the Census figure covers all renter-occupied housing in Avondale, AZ while the tracked market average covers units currently listed in larger apartment communities.
What salary do I need to live comfortably in Avondale, AZ?
Built on the 25 to 30 percent rent-to-income guideline used by most landlords and credit-scoring models.
Minimum to afford average rent
$70,000/year
Based on the 30 percent rule, using our tracked average rent of $1,743/mo.
Comfortable income
$84,000/year
Based on the 25 percent rule, leaving more room for savings, transport, and groceries.
To afford the cheapest tracked apartment ($1,168/mo), you need to earn at least $47,000/year.
Median household income in Avondale, AZ is $81,260 , about 3% below the comfortable-living threshold.
Cost of living in Avondale, AZ
Overall prices in Avondale, AZ runs above the national average by about 5% (BEA Regional Price Parity index 104.7, where 100 equals the U.S. average). The breakdown below estimates monthly costs for a single adult, using national consumer-spending baselines from the Bureau of Labor Statistics scaled by Avondale, AZ's regional price parities.
| Category | Monthly estimate |
|---|---|
| Rent (market average) | $1,743 |
| Utilities | $534 |
| Groceries | $531 |
| Transportation | $1,274 |
| Healthcare | $621 |
| Other goods and services | $994 |
| Estimated total | $5,699/mo |
Population
90,644
Median household income
$81,260
Census median rent
$1,731/mo
Rent as % of income
31.8%
Median age
32.4
Mean commute
28 min
Methodology
Rent data
Sourced directly from each tracked apartment community and refreshed every 24 hours. Every listed unit price on this page is real and listed today.
Cost of living
Estimates combine national consumer-spending baselines from the U.S. Bureau of Labor Statistics (Consumer Expenditure Survey) with the U.S. Bureau of Economic Analysis Regional Price Parities (MARPP dataset). Both are peer-reviewed federal data releases published annually.
Salary to live comfortably
Applies the standard 25 to 30 percent rent-to-income rule on top of the listed rent. This is the same affordability guideline used by most landlords and credit-scoring models.
Demographic figures
Median household income, population, median age, commute time, Census median rent, and rent as percentage of income come from the U.S. Census Bureau's American Community Survey 5-year estimates, the most recent complete release.
Cost of living and demographic figures were last published in 2023.
Compare
Nearby cities in Arizona
How Avondale, AZ rent compares to other markets in the state.
| City | Avg Rent | vs Avondale, AZ | Properties |
|---|---|---|---|
| Tempe, AZ | $2,149 | +23% | 20 |
| Scottsdale, AZ | $2,490 | +43% | 19 |
| Tucson, AZ | $1,780 | +2% | 15 |
| Goodyear, AZ | $1,794 | +3% | 14 |
| Surprise, AZ | $1,876 | +8% | 13 |
| Glendale, AZ | $1,600 | -8% | 12 |
Frequently asked questions
What is the average rent in Avondale, AZ?
The average rent in Avondale, AZ is $1,743 per month, based on 378 units across 15 apartment buildings tracked by Average Rent. Prices are refreshed daily.
What is the cheapest apartment rent in Avondale, AZ?
The lowest available rent in Avondale, AZ starts at $1,168 per month. Availability changes daily and prices are refreshed each morning.
How much is a 1-bedroom apartment in Avondale, AZ?
1-bedroom apartments in Avondale, AZ average $1,544/mo. The lowest listed 1-bedroom starts at $1,168/mo across 154 units tracked.
How much is a 2-bedroom apartment in Avondale, AZ?
2-bedroom apartments in Avondale, AZ average $1,771/mo. Units start from $1,394/mo across 156 units currently listed.
Rent Trends in Avondale, AZ
Track how apartment prices are changing over time.
Missing your neighborhood?
Tell us where you're looking. We'll start tracking prices within 24 hours.
Get Started